Corn
(ZCH24)
March
The short of it,
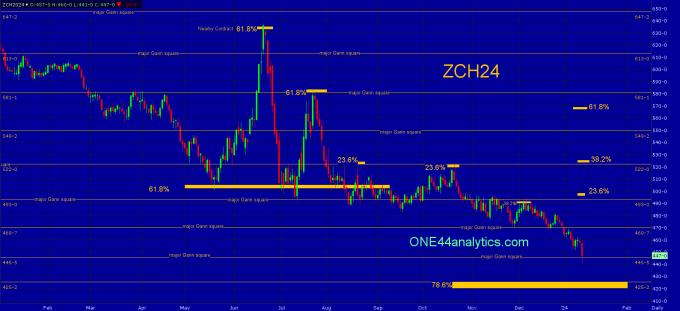
Use the 445.50 major Gann square as the swing point for the week.
Above it, look for the previous major Gann square at 469.75.
Below it, look for our long term target of 425.25.
Why is explained below.
The chart is key to this analysis.
Each of the past 5 attempts to rally were stopped by Fibonacci retracements and Major Gann squares. These are marked on the chart for the dates of 6/21/23, 7/24/23, 8/21/23, 10/20/23 and 12/6/23. When it took out 500.00 our long term target was 425.50. The reason for this is, it was the next major Fibonacci level below, a 78.6% retracement at 425.50, this is also a major Gann square. To get the long term targets above and below the levels mentioned above, you can become a Premium Member and get those well in advance.
We have done a couple new videos (36 in total) on how to use the Fibonacci retracements with the ONE44 rules and guideline. The latest ones deal with "When a certain retracement holds and we have a target based on the ONE44 rules and guidelines and it doesn't get there." and
"A Classic Fibonacci Reversal In The Market And How To Spot It."
ONE44 Analytics where the analysis is concise and to the point
Our goal is to not only give you actionable information, but to help you understand why we think this is happening based on pure price analysis with Fibonacci retracements, that we believe are the underlying structure of all markets and Gann squares.
If you like this type of analysis and trade the Grain/Livestock futures you can become a Premium Member.
You can also follow us on YouTube for more examples of how to use the Fibonacci retracements with the ONE44 rules and guidelines.
Sign up for our Free newsletter here.
FULL RISK DISCLOSURE: Futures trading contains substantial risk and is not for every investor. An investor could potentially lose all or more than the initial investment. Commission Rule 4.41(b)(1)(I) hypothetical or simulated performance results have certain inherent limitations. Unlike an actual performance record, simulated results do not represent actual trading. Also, since the trades have not actually been executed, the results may have under- or over-compensated for the impact, if any, of certain market factors, such as lack of liquidity. Simulated trading programs in general are also subject to the fact that they are designed with the benefit of hindsight. No representation is being made that any account will or is likely to achieve profits or losses similar to those shown. Past performance is not necessarily indicative of future results.
On the date of publication, Nick Ehrenberg did not have (either directly or indirectly) positions in any of the securities mentioned in this article. All information and data in this article is solely for informational purposes. For more information please view the Disclosure Policy here.
Disclaimer: The copyright of this article belongs to the original author. Reposting this article is solely for the purpose of information dissemination and does not constitute any investment advice. If there is any infringement, please contact us immediately. We will make corrections or deletions as necessary. Thank you.