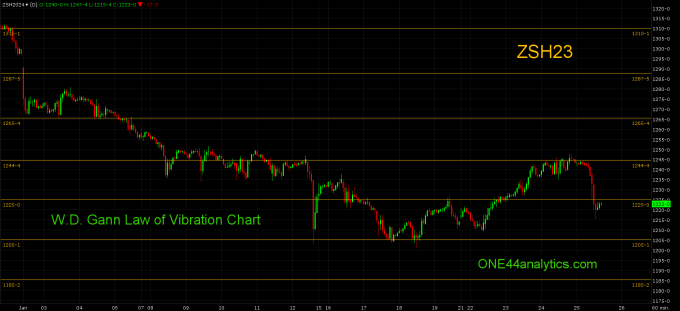
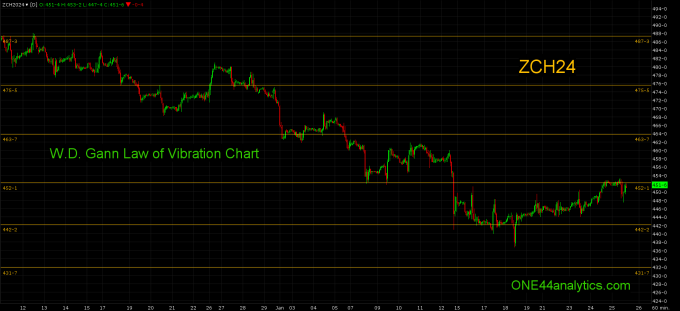
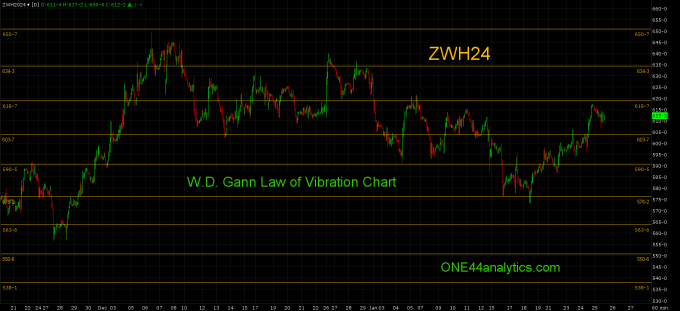
The Charts below are natural support and resistance levels that are based on W.D. Ganns "Law of Vibration".
- Mr Gann viewed stocks as live electrons, atoms, and molecules which hold persistently to their own individuality in response to the fundamental Law of Vibration. Science teaches 'that an original impulse of any kind finally resolves itself into periodic or rhythmical motion, also just as the pendulum returns again in its swing, just as the moon returns in its orbit, just as the advancing year ever brings the rise or spring, so do the properties of the elements periodically recur as the weight of the atoms rises'.
Each level can be used as support and then resistance once taken out and the reverse when starting as resistance. These levels will be good until the end of each contract, they are marked by the yellow horizontal lines.
The charts below are for short term support and resistance. We also post them on the Daily charts for the long term levels.
We also have over 30 videos on how to use the Fibonacci retracements with the ONE44 rules and guidelines.
This is our latest.
ONE44 Analytics where the analysis is concise and to the point
Our goal is to not only give you actionable information, but to help you understand why we think this is happening based on pure price analysis with Fibonacci retracements, that we believe are the underlying structure of all markets and Gann squares.
If you like this type of analysis and trade the Grain/Livestock futures you can become a Premium Member.
You can also follow us on YouTube for more examples of how to use the Fibonacci retracements with the ONE44 rules and guidelines.
Sign up for our Free newsletter here.
FULL RISK DISCLOSURE: Futures trading contains substantial risk and is not for every investor. An investor could potentially lose all or more than the initial investment. Commission Rule 4.41(b)(1)(I) hypothetical or simulated performance results have certain inherent limitations. Unlike an actual performance record, simulated results do not represent actual trading. Also, since the trades have not actually been executed, the results may have under- or over-compensated for the impact, if any, of certain market factors, such as lack of liquidity. Simulated trading programs in general are also subject to the fact that they are designed with the benefit of hindsight. No representation is being made that any account will or is likely to achieve profits or losses similar to those shown. Past performance is not necessarily indicative of future results.
On the date of publication, Nick Ehrenberg did not have (either directly or indirectly) positions in any of the securities mentioned in this article. All information and data in this article is solely for informational purposes. For more information please view the Disclosure Policy here.
Disclaimer: The copyright of this article belongs to the original author. Reposting this article is solely for the purpose of information dissemination and does not constitute any investment advice. If there is any infringement, please contact us immediately. We will make corrections or deletions as necessary. Thank you.