- The basis principle of Econ 101 is Market Price = the Intersection of Supply and Demand curves.
- Given this, if we use the National Cash Indexes for the 5 major grain markets we can see what the relationship is between supply and demand at any time.
- This doesn't tell us metric tons or bushels, but as it turns out, the actual (or imaginary) numbers are irrelevant.
It’s always interesting to see people struggle with the idea we can supply and demand in the Grains sector any day of any week of any month of any year simply by looking at the National Cash Indexes for the various markets. It’s not rocket science, but rather Econ 101, a course I’m sure almost everyone took at some point in their academic career. As I’ve said countless times over the years, I’m no economist (and extremely proud to remind folks of that fact), nor do I play one on television. I also didn’t stay at a well-known hotel chain last night, but I do remember the basic economic equation:
Market Price = The Intersection of Supply and Demand Curves
Heading into USDA’s quarterly Grain Stocks report released Monday, September 30, 2024, there was a great deal of chatter about how USDA’s survey-based “calculation” (and I use that term loosely) could be the largest in four years. There was plenty of shock and awe amongst the faithful followers of the more popular ag-related social media accounts, though those in the industry actually interested in making money met their posts with disinterest, outside of a few hearty chuckles. (It is easy to laugh at the folks in the industry who take government reports seriously.) After all, it’s easier to be profitable when others make foolish mistakes.
While I’m in the latter group, mostly, there is still part of me that feels obligated to try to teach people unwilling to learn. So, for the gazillionth time over the last nearly 30-plus years, let’s try this again. But first, a reminder: I DO NOT GIVE A RAT’S ARSE ABOUT THE NUMBERS USDA RELEASES. IT DOES NOT, WILL NOT, CHANGE MY VIEW OF REAL SUPPLY AND DEMAND. USDA’S NUMBERS ARE FOR ENTERTAINMENT PURPOSES ONLY. Okay, that’s out of the way, though again I doubt if it sinks in with the majority of the industry.

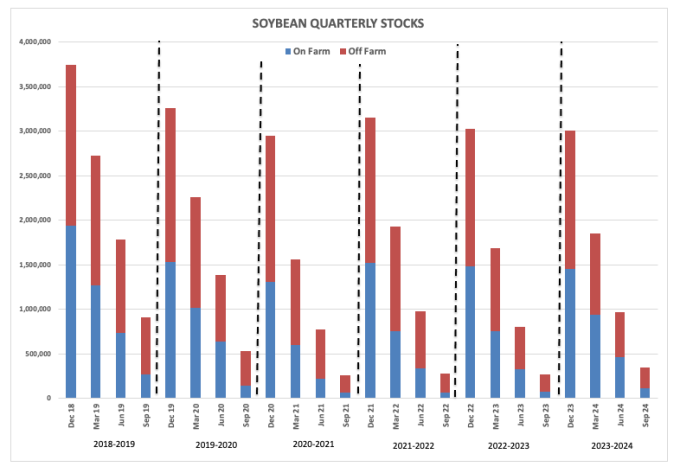
Soybeans: At the end of August 2024, the National Cash Indexes (national average cash prices) were all well below where they were priced a year ago. The biggest difference was in soybeans with the National Soybean Index (ISY00) coming in this year near $9.4850, down 30% from its’s end of August 2023 price of $13.4575. What does this tell us? The US supply of soybeans far outdistanced demand over the past year. That’s all, and yet, that’s all that matters. My end of August available stocks-to-use (stocks on hand in relation to demand) came in at 17.5%, the largest month end and August month end figure since 2020. In other words, all the gnashing of teeth and rending of garments over what USDA might say Monday was a waste of time, as the market already showed us available stocks-to-use at the end of August was the largest in four years. For the record: USDA’s quarterly number came in at 342 mb, the largest end of August estimate since – you guessed it – 2020’s estimate of 524.5 mb.
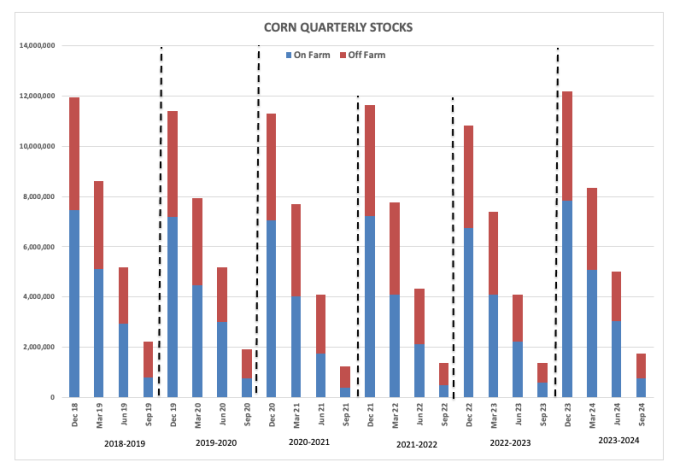
Corn: It was a similar situation with the National Corn Index (ICY00) calculated near $3.6850 at the end of August 2024. This was down 23% from the end of August 2023 calculation of $4.8150. As for available stocks-to-use, August 2024 came in at 13.6%, the largest month end figure since September 2020 at 13.8% (NCI ~ $3.52) and the largest end of August figure since 2020 as well at 14.4% (NCI ~ $3.26). What does this tell us? The combination of old-crop on-farm stocks coming to town along with early harvested bushels created larger supplies in relation to demand, and the cash index (intrinsic value of the market) reflected this. As for USDA’s nonsense, the September 1 number came in at 1.76 bb, again the largest since 2020’s 1.919 bb. But before we get overly bullish or bearish we have to keep in mind the 300 (400) Consistency. This reminds us that USDA’s quarterly stocks numbers, particularly its September 1 figure, tends to be off by 300 mb to 400 mb (it used to be 300 mb but has become 400 mb, or maybe more) from pre-report estimates (an asinine measure of accuracy if there ever was one).
All Wheat: A look at the three wheat cash indexes (IWY00) (IHY00) (IPY00) shows a clear consistency: US wheat supplies in relation to demand at the end of August 2024 were much larger than they were a year ago. The biggest change was seen in HRW wheat where the cash index was priced last month at $4.6950, down 29% from the previous August calculation of $6.57. The next largest was HRS with the 2024 figure of $5.3525 down 21% from August 2023’s $6.8025. SRW came in third with the August 2024 price of $4.4375 “only” 13% less than the August price of $5.1025. The National SRW Wheat Index was also the outlier in that it was the lowest end of August figure since 2019, where the other four indexes went back to August 2020. USDA’s September 1, 2019 all wheat quarterly stocks number came in at 2.387 bb, with 68% of those bushels reportedly in off-farm storage. This brings up another interesting point: My end of month calculations tend to run 40%-plus for the 3 wheat markets, far above what we see in corn and soybeans because wheat is taken to town at harvest with usually less than 1/3 of supplies held on farm. USDA’s September 1, 2024 guess for all wheat quarterly stocks came in at 1.986 bb with 67% in off-farm storage.

More Grain News from
- Sugar Prices Fall on Optimism for a Bumper Sugar Crop in India
- Weakness in Chocolate Sales Weighs on Cocoa Prices
- Coffee Prices Slip on Rain Forecasts for Brazil
- Wheat Trending Higher to Kick Off Monday
On the date of publication, Darin Newsom did not have (either directly or indirectly) positions in any of the securities mentioned in this article. All information and data in this article is solely for informational purposes. For more information please view the Disclosure Policy here.
Disclaimer: The copyright of this article belongs to the original author. Reposting this article is solely for the purpose of information dissemination and does not constitute any investment advice. If there is any infringement, please contact us immediately. We will make corrections or deletions as necessary. Thank you.