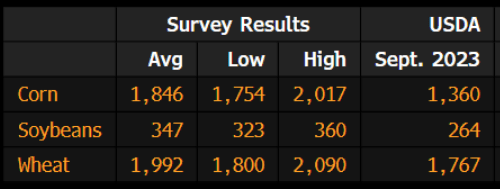
Quarterly Stocks Estimates
The quarterly stocks report will be out on Monday, September 30th. Market action following the release of the report has been split over the last 10 years with 5 higher closes and 5 lower closes for both corn and soybeans.
Corn
Technicals (December)
December corn futures poked their head out above first resistance, trading to their highest price since July 26th. However, that strength failed to hold through the session as prices reversed and finished lower on the day. The bearish reversal has spilled into weakness overnight and into the early morning trade with prices revisiting our pivot pocket from 408 1/2-409. If the Bulls fail to hold ground here, we could see prices right back at the lower end of the range which we’ve outlined as 401-403 3/4.
Technical Levels of Importance
- Resistance: 413 1/2-416, 423 3/4-426 1/2*
- Pivot: 408 1/2-409
- Support: 401-403 3/4, 380-385
Seasonal Tendency Update
Below is a look at price averages for December corn over the last 5, 10, 15, 20, and 30 years. Past performance is not necessarily indicative of future results.

Soybeans
Technicals (November)
Like corn, November soybean futures traded to their highest levels since July 26th but failed to hold that strength through the session. Despite still finishing the day in positive territory, the bearish reversal has led to weakness in the overnight and early morning trade with prices right back to our first support pocket from 1031 3/4-1035. A failure here and we could be right back to where we started the week near 1012, which also aligns with the 50day moving average.
Technical Levels of Importance
- Resistance: 1082 1/2-1086 3/4*
- Pivot: 1041 3/4-1042
- Support: 1031 3/4-1035, 1023-1024 1/2, 1000-1006 1/2
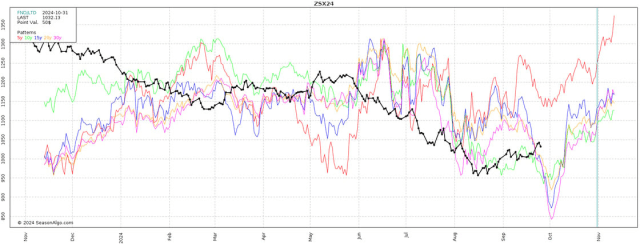
Seasonal Tendency Update
Below is a look at price averages for November soybeans over the last 5, 10, 15, 20, and 30 years. Past performance is not necessarily indicative of future results.
Ready to dig in?
Subscribe to our daily Grain Express for fresh insights into Soybeans, Wheat, and Corn. Get our expert technical analysis, proprietary trading levels, and actionable market bias delivered right to your inbox.
Sign Up for Free Futures Market Research – Blue Line Futures
Futures trading involves substantial risk of loss and may not be suitable for all investors. Therefore, carefully consider whether such trading is suitable for you in light of your financial condition. Trading advice is based on information taken from trade and statistical services and other sources Blue Line Futures, LLC believes are reliable. We do not guarantee that such information is accurate or complete and it should not be relied upon as such. Trading advice reflects our good faith judgment at a specific time and is subject to change without notice. There is no guarantee that the advice we give will result in profitable trades. All trading decisions will be made by the account holder. Past performance is not necessarily indicative of future results.
Blue Line Futures is a member of NFA and is subject to NFA’s regulatory oversight and examinations. However, you should be aware that the NFA does not have regulatory oversight authority over underlying or spot virtual currency products or transactions or virtual currency exchanges, custodians or markets. Therefore, carefully consider whether such trading is suitable for you considering your financial condition.
With Cyber-attacks on the rise, attacking firms in the healthcare, financial, energy and other state and global sectors, Blue Line Futures wants you to be safe! Blue Line Futures will never contact you via a third party application. Blue Line Futures employees use only firm authorized email addresses and phone numbers. If you are contacted by any person and want to confirm identity please reach out to us at info@bluelinefutures.com or call us at 312- 278-0500
Performance Disclaimer
Hypothetical performance results have many inherent limitations, some of which are described below. No representation is being made that any account will or is likely to achieve profits or losses similar to those shown. In fact, there are frequently sharp differences between hypothetical performance results and the actual results subsequently achieved by any particular trading program.
One of the limitations of hypothetical performance results is that they are generally prepared with the benefit of hindsight. In addition, hypothetical trading does not involve financial risk, and no hypothetical trading record can completely account for the impact of financial risk in actual trading. For example, the ability to withstand losses or to adhere to a particular trading program in spite of trading losses are material points which can also adversely affect actual trading results. There are numerous other factors related to the markets in general or to the implementation of any specific trading program which cannot be fully accounted for in the preparation of hypothetical performance results and all of which can adversely affect actual trading results.
On the date of publication, Oliver Sloup did not have (either directly or indirectly) positions in any of the securities mentioned in this article. All information and data in this article is solely for informational purposes. For more information please view the Disclosure Policy here.
Disclaimer: The copyright of this article belongs to the original author. Reposting this article is solely for the purpose of information dissemination and does not constitute any investment advice. If there is any infringement, please contact us immediately. We will make corrections or deletions as necessary. Thank you.