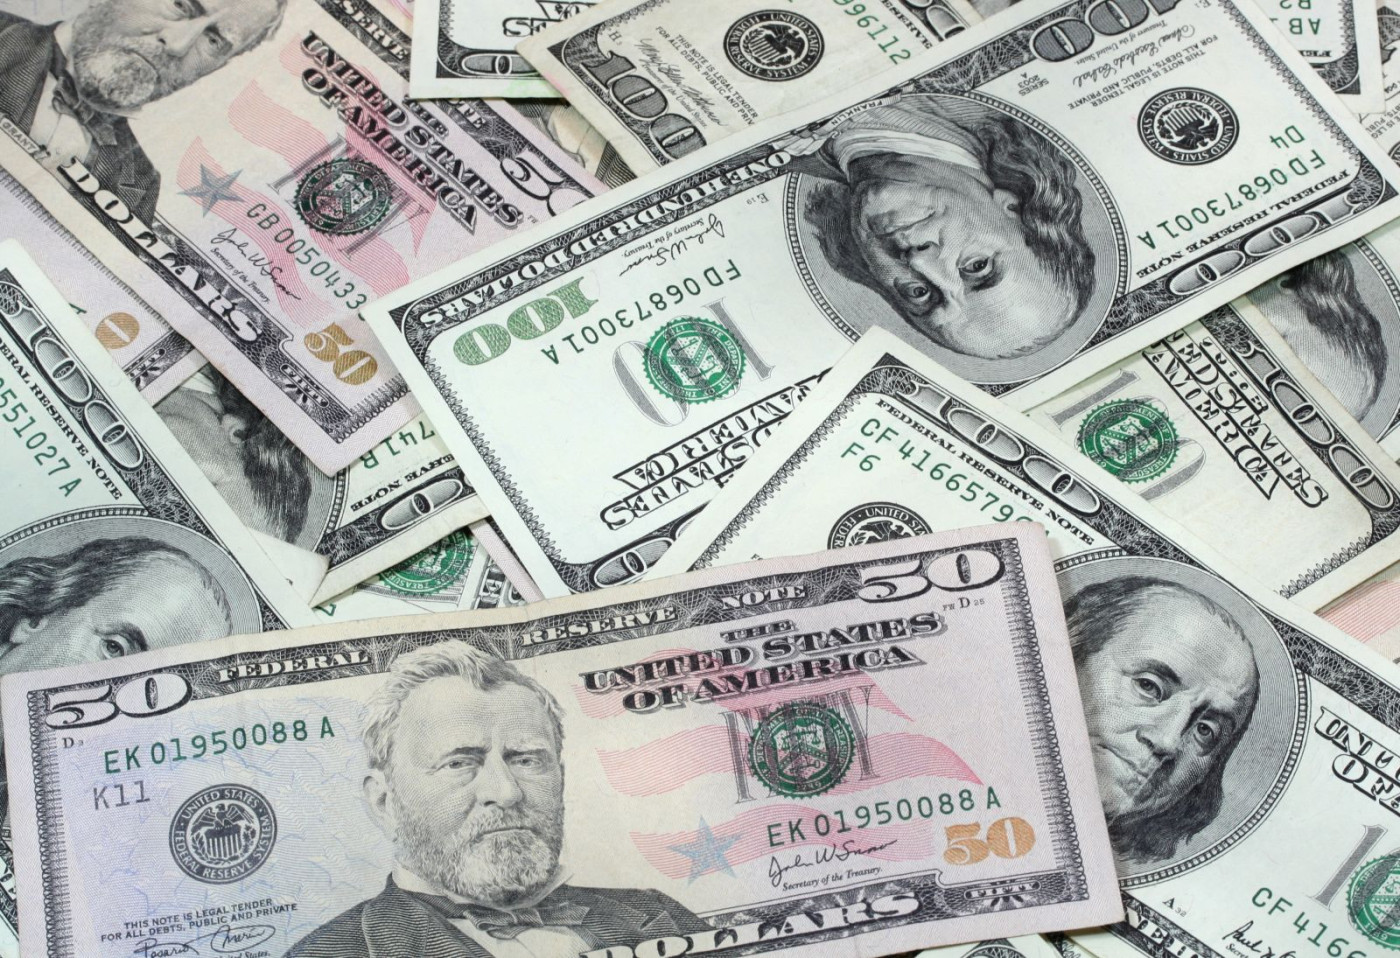
Gold
(GCZ24)
December
The chart is key to this analysis.
When any market gets beyond the Fibonacci retracements, we go to the major Gann squares for targets and then as the swing point when closed above.
Looking back at the lows on 5/3/24, 6/10/24 and 6/26/24 you can see how the 2345.70 major Gann square held this market up. Then the lows on 7/25/24 and 8/5/24 held the 2400.90 major Gann square, there were also a couple retracements in this area for added support.
The lows between 8/22/24 and 9/9/24 held the 2514.00 major Gann square before going on to new highs.
In our last update we said to use the 2578.40 major Gann square as the swing point for the week once it closed above it. Wednesday and Thursday came back to test it and it has now closed above the 2639.40 major Gann square.
We will now use 2639.40 as the swing point for the week.
The short term target above is the next major Gann square at 2706.50. The long term target that we have had since August remains at 2775.00.
On the downside we will watch the Fibonacci retracements back to the 6/10/24 low. The first level to watch is 23.6% at 2578.40, this is also a major Ganns square. Holding this level keeps the trend extremely strong per the ONE44 23.6% rule.
We have done 42 videos on how to use the Fibonacci retracements with the ONE44 rules and guidelines. These Videos are worth watching even if it is not in the market you are trading, as the ONE44 rules and guidelines are the same for every market. You will also see why we believe the Fibonacci retracements are the underlying structure of ALL markets.
This is our latest video with analysis on Soybean Oil and the S&P 500 Futures.
.
To get future updates on Gold, Crude Oil and the S&P 500, Use this link.
.

.
.ONE44 Analytics where the analysis is concise and to the point
Our goal is to not only give you actionable information, but to help you understand why we think this is happening based on pure price analysis with Fibonacci retracements, that we believe are the underlying structure of all markets and Gann squares.
If you like this type of analysis and trade the Grain/Livestock futures you can become a Premium Member.
You can also follow us on YouTube for more examples of how to use the Fibonacci retracements with the ONE44 rules and guidelines.
FULL RISK DISCLOSURE: Futures trading contains substantial risk and is not for every investor. An investor could potentially lose all or more than the initial investment. Commission Rule 4.41(b)(1)(I) hypothetical or simulated performance results have certain inherent limitations. Unlike an actual performance record, simulated results do not represent actual trading. Also, since the trades have not actually been executed, the results may have under- or over-compensated for the impact, if any, of certain market factors, such as lack of liquidity. Simulated trading programs in general are also subject to the fact that they are designed with the benefit of hindsight. No representation is being made that any account will or is likely to achieve profits or losses similar to those shown. Past performance is not necessarily indicative of future results.
On the date of publication, Nick Ehrenberg did not have (either directly or indirectly) positions in any of the securities mentioned in this article. All information and data in this article is solely for informational purposes. For more information please view the Disclosure Policy here.
Disclaimer: The copyright of this article belongs to the original author. Reposting this article is solely for the purpose of information dissemination and does not constitute any investment advice. If there is any infringement, please contact us immediately. We will make corrections or deletions as necessary. Thank you.