Watch us on RFD-TV, today at 12:45pm CT!
On September 30, the USDA will release its Quarterly Grain Stocks report. According to Oliver Sloup of Blue Line Futures, this report has historically been unpredictable, with corn and soybean prices closing higher or lower with equal likelihood, and average trading ranges of 3.55% for corn and 2.83% for soybeans over the past decade. Will this year be different?
Corn
Technicals (December)
December corn futures are retreating back to our pivot pocket this morning, we've outlined that as 408 1/2-409. If you're bullish, you may consider this pocket a good risk/reward setup to the long side. However, a failure to hold here opens the door for a retest of 401-403 3/4. The volatility is low, so utilizing options to hedge futures or as an outright position may be something to consider. The daily average trading range over a 14-day period is down to its lowest level since May, about 6 3/4 cents.
Technical Levels of Importance
- Resistance: 413 1/2-416, 423 3/4-426 1/2*
- Pivot: 408 1/2-409
- Support: 401-403 3/4, 380-385
Export Sales Estimates
This morning's weekly export sales report will be out at 7:30am CT. Estimates range from 550,000-1,400,000 metric tons. Last week was reported at 666,500 MT.
Ethanol
This morning's weekly EIA ethanol report showed ethanol stocks at 23.785 million barrels, above expectations of 23.74. Production was reported at 1.049 million, below expectations of 1.052.
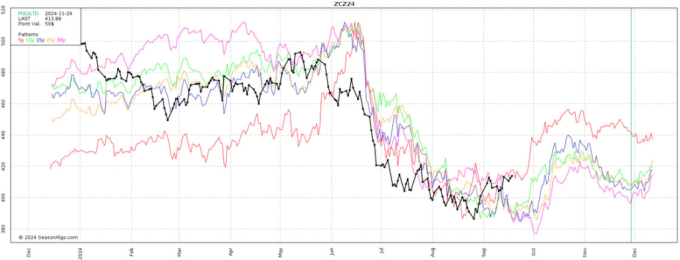
Seasonal Tendency Update
Past performance is not necessarily indicative of future results
Below is a look at this year's price action (black line) VS price averages for December corn over 5, 10, 15, 20, and 30 year periods. Historically the market makes an attempt at a harvest low between now and the first week of October. Keep in mind that we do have a quarterly USDA report on September 30th.
Soybeans
Technicals (November)
November soybeans looked like they were going to attempt a breakout move yesterday, but the early morning strength never really materialized to follow-through buying in yesterday's trade. The lack of conviction from buyers has prices setting back this morning, testing our pivot pocket from 1000-1006 1/2. A break and close below here could trigger another wave of selling pressure. This could be triggered by harvest pressure or more friendly forecasts for Brazil. Seasonally, this is still a tough time of year for beans to stage a meaningful rally (as discussed below).
Technical Levels of Importance
- Resistance: 1023-1024 1/2, 1031 3/4-1035
- Pivot: 1000-1006 1/2
- Support: 984 3/4-991, 973 1/4, 950-955 1/4*
Export Sales Estimates
This morning's weekly export sales report will be out at 7:30am CT. Estimates range from 500,000-1,600,000 metric tons. Last week was reported at 1,474,000 MT.
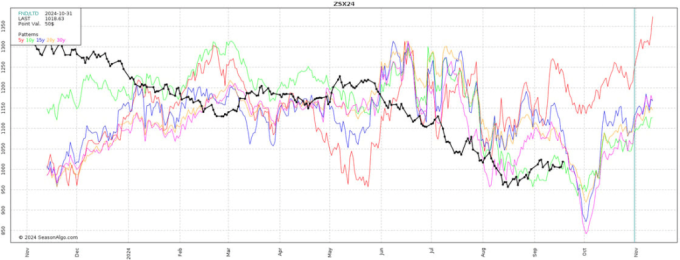
Seasonal Tendency Update
Past performance is not necessarily indicative of future results
Below is a look at this year's price action (black line) VS price averages for November soybeans over 5, 10, 15, 20, and 30 year periods. Historically the market struggles in the back half of September before attempting to make a harvest low in early October. Weather in Brazil could be the catalyst to make or break that trend as dry weather raises concerns. Keep in mind that we do have a quarterly USDA report on September 30th.
Ready to dig in?
Subscribe to our daily Grain Express for fresh insights into Soybeans, Wheat, and Corn. Get our expert technical analysis, proprietary trading levels, and actionable market bias delivered right to your inbox.
Sign Up for Free Futures Market Research – Blue Line Futures
Futures trading involves substantial risk of loss and may not be suitable for all investors. Therefore, carefully consider whether such trading is suitable for you in light of your financial condition. Trading advice is based on information taken from trade and statistical services and other sources Blue Line Futures, LLC believes are reliable. We do not guarantee that such information is accurate or complete and it should not be relied upon as such. Trading advice reflects our good faith judgment at a specific time and is subject to change without notice. There is no guarantee that the advice we give will result in profitable trades. All trading decisions will be made by the account holder. Past performance is not necessarily indicative of future results.
Blue Line Futures is a member of NFA and is subject to NFA’s regulatory oversight and examinations. However, you should be aware that the NFA does not have regulatory oversight authority over underlying or spot virtual currency products or transactions or virtual currency exchanges, custodians or markets. Therefore, carefully consider whether such trading is suitable for you considering your financial condition.
With Cyber-attacks on the rise, attacking firms in the healthcare, financial, energy and other state and global sectors, Blue Line Futures wants you to be safe! Blue Line Futures will never contact you via a third party application. Blue Line Futures employees use only firm authorized email addresses and phone numbers. If you are contacted by any person and want to confirm identity please reach out to us at info@bluelinefutures.com or call us at 312- 278-0500
Performance Disclaimer
Hypothetical performance results have many inherent limitations, some of which are described below. No representation is being made that any account will or is likely to achieve profits or losses similar to those shown. In fact, there are frequently sharp differences between hypothetical performance results and the actual results subsequently achieved by any particular trading program.
One of the limitations of hypothetical performance results is that they are generally prepared with the benefit of hindsight. In addition, hypothetical trading does not involve financial risk, and no hypothetical trading record can completely account for the impact of financial risk in actual trading. For example, the ability to withstand losses or to adhere to a particular trading program in spite of trading losses are material points which can also adversely affect actual trading results. There are numerous other factors related to the markets in general or to the implementation of any specific trading program which cannot be fully accounted for in the preparation of hypothetical performance results and all of which can adversely affect actual trading results.
On the date of publication, Oliver Sloup did not have (either directly or indirectly) positions in any of the securities mentioned in this article. All information and data in this article is solely for informational purposes. For more information please view the Disclosure Policy here.
Disclaimer: The copyright of this article belongs to the original author. Reposting this article is solely for the purpose of information dissemination and does not constitute any investment advice. If there is any infringement, please contact us immediately. We will make corrections or deletions as necessary. Thank you.