Gold
(GCZ24)
December
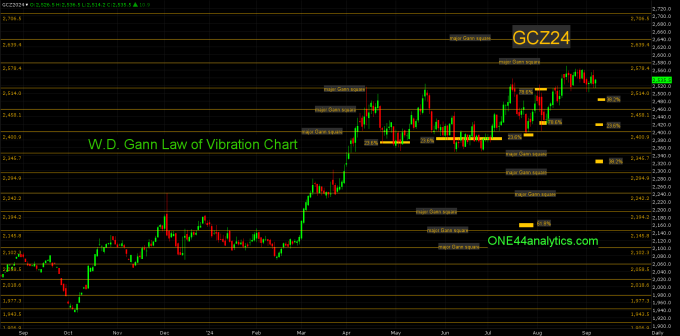
The chart below is key to this analysis.
There are two methods we use at ONE44 to find support and resistance in the markets.
The first are major Gann squares, these are the yellow horizontal lines on the chart. On the chart you can see where the market turned multiple times at these levels.You can use each of the levels as Support/Resistance and when it is closed through, you can use it as the swing point and look for the next level.
The second is Fibonacci retracements and this is what most of this post will be about.
There are a few basic rules when using the Fibonacci retracements with the ONE44 rules and guidelines.
This is the short version.
A 38.2% level keeps the trend intact and new highs/lows should follow.
A 23.6% level shows the market is extremely strong, or weak.
A 61.8% level can cause wide swings and keep the market in a trading range.
A 78.6% level can send it 78.6% of where it just came from and even be the end or start of a Bull market.
We have done 38 videos on how to use the Fibonacci retracements with the ONE44 rules and guidelines.
These are the two most important.
Gold
9/9/24
The Gold market continues to be in a very strong position holding 23.6% retracements on the setbacks. This retracement has held the nearby contract on 4/23/24, 6/5/24 and again on 7/25/24.
You can also see where the market has found support and resistance at the major Gann squares on so many of the highs and lows.
Use the 2514.00 major Gann square as the swing point for the week.
Above it the long term target is 2775.00. The short term target is the next major Gann square at 2578.40.
Below it, look for 23.6% back to the October 2022 low at 2422.00. Any setback that holds 38.2% back to the 6/10/24 low keeps the trend extremely positive and new highs can quickly follow.
If you are interested in getting occasional free updates for Gold, Equites and Crude Oil you can,
Sign up Here
ONE44 Analytics where the analysis is concise and to the point
Our goal is to not only give you actionable information, but to help you understand why we think this is happening based on pure price analysis with Fibonacci retracements, that we believe are the underlying structure of all markets and Gann squares.
You can also follow us on YouTube for more examples of how to use the Fibonacci retracements with the ONE44 rules and guidelines.
FULL RISK DISCLOSURE: Futures trading contains substantial risk and is not for every investor. An investor could potentially lose all or more than the initial investment. Commission Rule 4.41(b)(1)(I) hypothetical or simulated performance results have certain inherent limitations. Unlike an actual performance record, simulated results do not represent actual trading. Also, since the trades have not actually been executed, the results may have under- or over-compensated for the impact, if any, of certain market factors, such as lack of liquidity. Simulated trading programs in general are also subject to the fact that they are designed with the benefit of hindsight. No representation is being made that any account will or is likely to achieve profits or losses similar to those shown. Past performance is not necessarily indicative of future results.
On the date of publication, Nick Ehrenberg did not have (either directly or indirectly) positions in any of the securities mentioned in this article. All information and data in this article is solely for informational purposes. For more information please view the Disclosure Policy here.
Disclaimer: The copyright of this article belongs to the original author. Reposting this article is solely for the purpose of information dissemination and does not constitute any investment advice. If there is any infringement, please contact us immediately. We will make corrections or deletions as necessary. Thank you.