So yes, that’s exactly what happened – the GDXJ closed the weekly with a record (nominal) decline – one that we haven’t seen since May 2022.
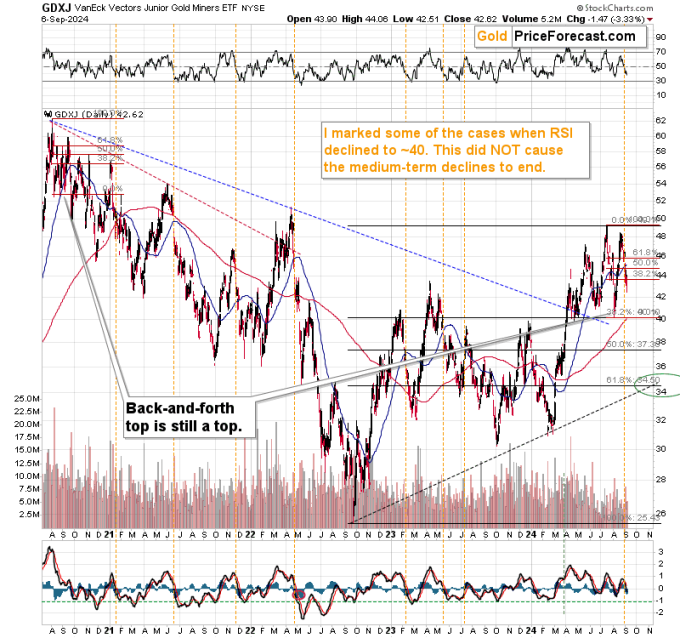
The above chart shows that the multi-top that the GDXJ is most likely forming is indeed (as I wrote about it before) similar to what we saw at the 2020 top.
Zooming in reveals that the multi-top can be viewed as a potential head-and-shoulders pattern with the downside target at about $33. The previous chart suggests that the next local bottom could form close to $34 (61.8% Fibonacci retracement plus the rising medium-term support line), so overall we can say that the GDXJ is likely to form some kind of bottom in the $33 - $34 area.
But let’s make it clear – the rally would be likely to start from this area is likely to be just a correction within a bigger move lower. The below HUI Index chart (proxy for gold stocks) shows the big picture.
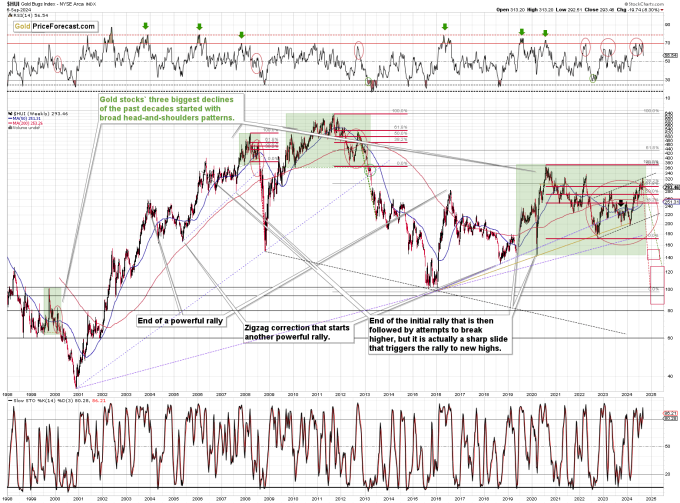
The HUI Index is after a huge zig-zag correction that started in late 2022 and ended very recently. The rising dashed lines are parallel – the rally that started in 2022 was similar to the one that started (and likely ended) this year.
And all this is likely to have been a zig-zag correction of the declined that started in 2020.
Taking an even broader perspective, we see that the entire 2019 – now performance is similar to what we saw in 2007-2008 and then between 2009 and 2012 – I marked those areas with green rectangles.
Those huge head-and-shoulders patterns were previously followed by enormous declines, which very few were able to take advantage of. Most people were simply hurt or scared, and in most cases both. Very few profited on those declines. Here’s our chance not to make this kind of mistake again, and to make a lot of money while being strong and patient. Of course, that’s just my opinion, as anything can happen on the markets, and I can’t promise any specific rate of return. However, I do think that this is one of those opportunities that – if you miss them – you’ll regret for many years.
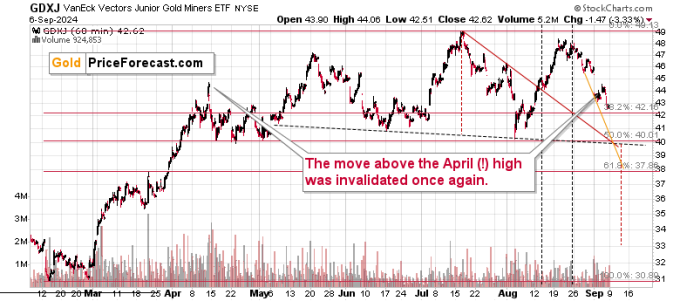
Getting back to the more recent events, please note how weak junior mining stocks were.
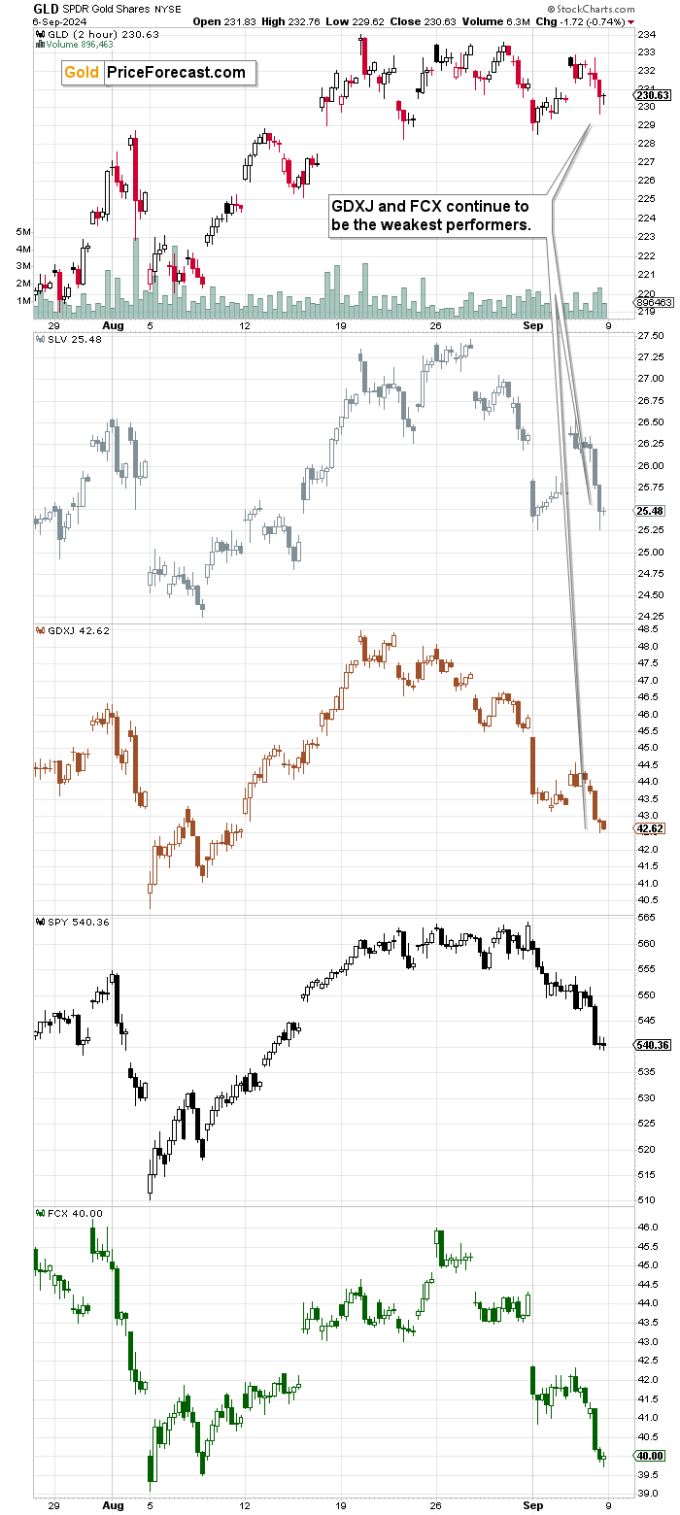
Gold (GLD) was down on Friday, but didn’t move to its recent low. Silver moved to it, and junior miners moved below it. FCX was even weaker. Everyone shorting either junior miners or FCX were likely quite happy with their performance.
The decline might seem excessive, but in reality – as seen on the long-term HUI Index chart – it’s most likely just starting.
Sure, there will be corrections even within this huge decline, and one could take place as early as this week, as there are three support lines crossing at about $40 as that’s where we have the 50% Fibonacci retracement. If GDXJ moves there on Tuesday (or early on Wednesday or late on Monday), it seems that we might see a rebound that day-traders might want to take advantage of.
I started today’s analysis by commenting on how big last week’s decline in the GDXJ was. But that’s not all that happened on a weekly basis.

Bitcoin, the “new gold” just closed the week at the levels not seen since February! Yes, it did move lower on an intraday basis, but I mean the weekly closing prices. Last week’s close was the lowest weekly close since February.
The trend here is clear, especially that we saw three failed attempts to move above the 2021 high. In fact, bitcoin also failed to hold above the earlier 2021 high – it’s all a very bearish combination for the following months. The last time bitcoin failed in a similar way was in late-2021, which was followed by a slide from about $70k to about $15k.
Why is this important for the precious metals investors and traders? Because the previous plunges in bitcoin preceded the plunges in mining stocks (and the rest of the precious metals market). And history tends to rhyme, remember?
It seems to be rhyming also in case of the USD Index.

After moving back up after the breakdown below the rising support line it moved back down and then up again. This is very similar to what we saw about a year ago – I marked both cases with green rectangles. Back then, the USD Index was after a breakdown below the previous lows and the 100 level. When it came back up, it then moved down sharply which was followed by another move lower – then more rallies came. It seems that that’s what’s next in this case as well.
The USD Index’s long-term chart confirms it.

The U.S. currency is after a breakdown below its rising, long-term support line, which would normally be viewed as bearish BUT each case when we saw analogous breakdowns, powerful rallies started.
Please note that right now, the USD Index is verifying the breakout above the previous highs – the ones that formed between 2015 and 2020. Overall, the orange zone that used to be resistance has been providing support for a few years now.
It’s interesting, because when we saw previous breakout above the previous long-term highs – in 2014, the USD Index then first soared and then moved back to the previous highs twice – before launching another powerful upswing. The really big rallies started close to the middle of the year or at least not far from it – the mid-2014 and mid-2021 bottoms were followed by them.
Right now, we are still relatively close to the middle of the year and the RSI indicator (upper part of the above chart) based on the weekly price moves was just below 30 indicating a very oversold condition. The previous cases when we saw something as extreme was when the USD Index bottomed in 2011, 2017, and 2018. The 2011 and 2018 bottoms were followed by huge rallies in the USDX.
All in all, the USD Index is likely to soar in the following weeks and months, while the commodity sector as well as precious metals are likely to decline. Junior mining stocks are likely to fall particularly hard as:
- a) They are already doing.
- b) Their long-term technical picture suggests.
- c) The stock market declines given it’s overbought status (junior miners are more correlated with stocks than other parts of the precious metals market during stock market declines).
Back in 2008 and in 2012/2013 people were scared or hurt by the declines. The above analysis indicates that it’s possible to profit on those declines instead – and in my view – the profits in this case could be legendary.
Thank you for reading my today’s free analysis. If you’d like to read more and stay up-to-date with the quick trades, intraday Gold Trading Alerts, and all the key details (trading position details, profit-take levels) that my subscribers are getting, I invite you to sign up for my Gold Trading Alerts or the Diamond Package that includes them. Alternatively, if you’re not ready to subscribe yet, I encourage you to sign up for my free gold newsletter today.
You might also want to check out this article featuring a very interesting opportunity to earn 12% per year on top of silver’s performance.
Thank you.
Przemyslaw K. Radomski, CFA
Founder, Editor-in-chief
On the date of publication, Przemyslaw K. Radomski did not have (either directly or indirectly) positions in any of the securities mentioned in this article. All information and data in this article is solely for informational purposes. For more information please view the Disclosure Policy here.
Disclaimer: The copyright of this article belongs to the original author. Reposting this article is solely for the purpose of information dissemination and does not constitute any investment advice. If there is any infringement, please contact us immediately. We will make corrections or deletions as necessary. Thank you.