Live Cattle
Technicals (October – V)
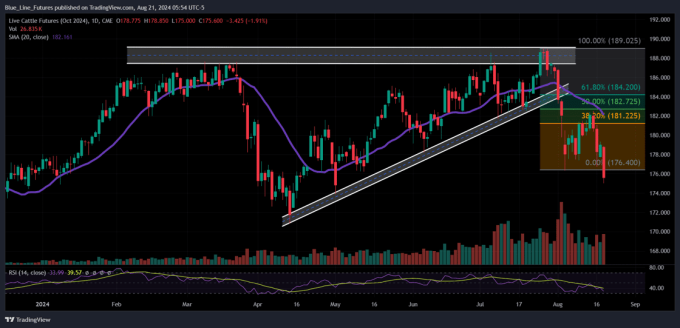
October live cattle made new lows for the move, closing below 3-star support from 176.35-177.22 (this will now act as our pivot pocket), which opens the door for a potential retest of the April lows at 170.82. Despite the sharp selloff the RSI is still above oversold territory, thanks to some recent consolidation.
- Resistance: 179.35-180.50**, 182.675-183.275****
- Pivot: 176.35-177.22
- Support: 173.87**, 170.82**
Daily Cattle Summary
- Yesterday afternoon’s cutout values on the softer side with choice cuts down .47 to 315.08 and select cuts down .97 to 301.04. Daily slaughter was reported at 124k head.
Below: Daily chart of October live cattle which illustrates the recent recovery back near the middle of the recent range.
Seasonal Tendencies
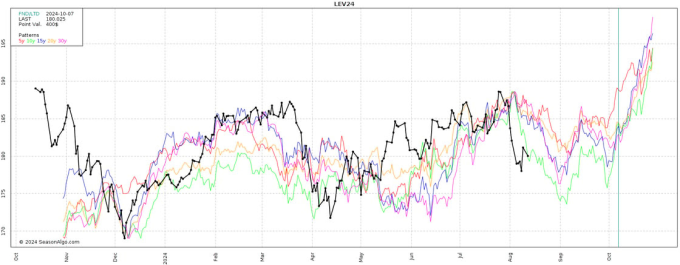
- Below is a look at prices averages for October live cattle over the last 5, 10, 15, 20, and 30 years. As referenced many times last month, August can be a tricky year to stage a meaningful rally. Those headwinds start to subside some when we turn the calendar over to September. *Past performance is not necessarily indicative of future results.
Feeder Cattle
Technicals (September- U)
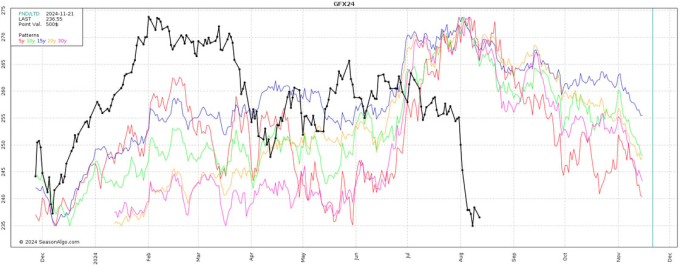
September feeder cattle made new lows, officially marking a full retracement with a revisit to the December lows. Where do we go from here is the big question. We’ve had a bearish tilt for several weeks now, but downside objectives are being hit and the short-term risk may be shifting back to the upside. A close back above 236.57-237.00 could start to encourage additional relief and repair some of the technical damage that has been done.
- Resistance: 238.97-239.15***,242.15-242.22
- Pivot: 236.57-237.00
- Support: 232.75-233.95****
Below: Daily chart of September feeder cattle that illustrates the accelerated selling pressure that took place following a break below trendline support. Also included is a set of Fibonacci retracements from this year’s trading range.

Seasonal Tendencies
- Below is a look at prices averages for November feeder cattle over the last 5, 10, 15, 20, and 30 years. We are using November so you can see the longer trend as opposed to the front months which are on a much shorter time frame. As referenced many times last month, August can be a tricky year to stage a meaningful rally. Those headwinds start to subside some when we turn the calendar over to September, but that strength has often been short lived. *Past performance is not necessarily indicative of future results.
Lean Hogs
Technicals (October – V)
October lean hogs are continuing to consolidate near trendline resistance. If the market can get out above Monday’s high of 77.27 we could see that spark some more upward momentum towards more meaningful resistance from 78.55-78.70, above that opens the door for 81.80-82.00. On the flipside, a break back below 73.90-74.45 puts the Bears back in the driver’s seat.
- Resistance: 78.55-78.70***, 81.80-82.00****
- Pivot: 73.90-74.45
- Support: 72.42-72.475***, 68.05-68.10****
Below is the daily chart for October lean hogs. The market has been consolidating between trendline resistance and a previously important inflection point near 74.
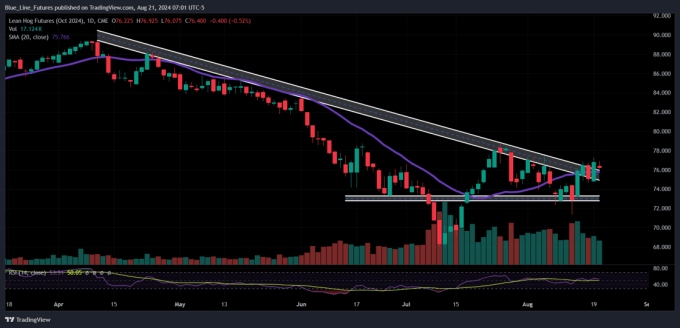
Chart of Interest
Below is a look at price averages for October lean hogs over the last 5, 10, 15, 20, and 30 years. The chart below illustrates some seasonal weakness into the middle of August, but then that turns more friendly through the remainder of the contract’s life. Important to remember that past performance is not necessarily indicative of future results.

Want to keep reading?
Subscribe to our daily Livestock Roundup for daily insights into Feeder Cattle, Live Cattle, and Lean Hogs technicals, including our proprietary trading levels, and actionable market bias.
Sign Up for Free Futures Market Research – Blue Line Futures
Futures trading involves substantial risk of loss and may not be suitable for all investors. Therefore, carefully consider whether such trading is suitable for you in light of your financial condition. Trading advice is based on information taken from trade and statistical services and other sources Blue Line Futures, LLC believes are reliable. We do not guarantee that such information is accurate or complete and it should not be relied upon as such. Trading advice reflects our good faith judgment at a specific time and is subject to change without notice. There is no guarantee that the advice we give will result in profitable trades. All trading decisions will be made by the account holder. Past performance is not necessarily indicative of future results.
Blue Line Futures is a member of NFA and is subject to NFA’s regulatory oversight and examinations. However, you should be aware that the NFA does not have regulatory oversight authority over underlying or spot virtual currency products or transactions or virtual currency exchanges, custodians or markets. Therefore, carefully consider whether such trading is suitable for you considering your financial condition.
With Cyber-attacks on the rise, attacking firms in the healthcare, financial, energy and other state and global sectors, Blue Line Futures wants you to be safe! Blue Line Futures will never contact you via a third party application. Blue Line Futures employees use only firm authorized email addresses and phone numbers. If you are contacted by any person and want to confirm identity please reach out to us at info@bluelinefutures.com or call us at 312- 278-0500
Performance Disclaimer
Hypothetical performance results have many inherent limitations, some of which are described below. No representation is being made that any account will or is likely to achieve profits or losses similar to those shown. In fact, there are frequently sharp differences between hypothetical performance results and the actual results subsequently achieved by any particular trading program.
One of the limitations of hypothetical performance results is that they are generally prepared with the benefit of hindsight. In addition, hypothetical trading does not involve financial risk, and no hypothetical trading record can completely account for the impact of financial risk in actual trading. For example, the ability to withstand losses or to adhere to a particular trading program in spite of trading losses are material points which can also adversely affect actual trading results. There are numerous other factors related to the markets in general or to the implementation of any specific trading program which cannot be fully accounted for in the preparation of hypothetical performance results and all of which can adversely affect actual trading results.
On the date of publication, Oliver Sloup did not have (either directly or indirectly) positions in any of the securities mentioned in this article. All information and data in this article is solely for informational purposes. For more information please view the Disclosure Policy here.
Disclaimer: The copyright of this article belongs to the original author. Reposting this article is solely for the purpose of information dissemination and does not constitute any investment advice. If there is any infringement, please contact us immediately. We will make corrections or deletions as necessary. Thank you.