Live Cattle
Technicals (October – V)
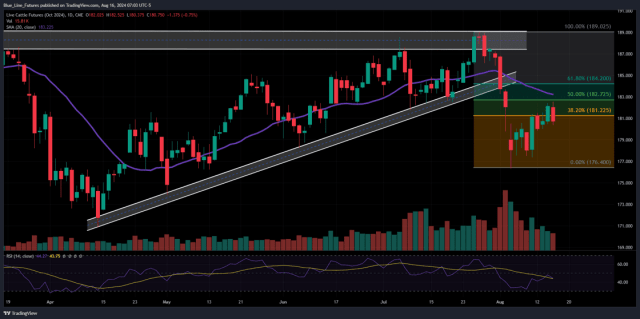
Live cattle futures came out of the gate with some strength yesterday, trading within 15 cents of our resistance pocket from 182.675-183.275, before retreating and reversing back lower to trade within our support pocket from 179.35-180.50 (settling at 180.75). If that support pocket gives way, we could see the selling momentum pick back up in a more meaningful way with the next downside target coming in from 176.35-177.22. Our bias of “sell rallies” remains intact, particularly for those who need downside protection. A break and close above our 4-star resistance pocket would neutralize that bias.
- Resistance: 182.675-183.275*
- Pivot: 181.175-181.50
- Support: 179.35-180.50**, 176.35-177.22
Daily Cattle Summary
Yesterday afternoon’s cutout values were firm with choice cuts up 2.06 to 316.94 and select cuts 1.53 higher to 302.03. Daily slaughter was reported at 120k head. The 5-area average price for live steers was at 187.63, on light volume.
Weekly Export Sales: Thursday’s weekly export sales report showed net sales beef were reported at 28,100 MT for 2024–a marketing-year high–were up noticeably from the previous week and up 99 percent from the prior 4-week average.
Below: Daily chart of October live cattle which illustrates the recent recovery back near the middle of the recent range.
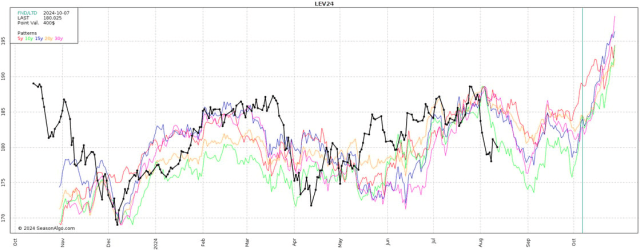
Seasonal Tendencies
Below is a look at prices averages for October live cattle over the last 5, 10, 15, 20, and 30 years. As referenced many times last month, August can be a tricky year to stage a meaningful rally. Those headwinds start to subside some when we turn the calendar over to September. *Past performance is not necessarily indicative of future results.
Feeder Cattle
CME Feeder Cattle Index: 246.34 +1.02
Technicals (September- U)
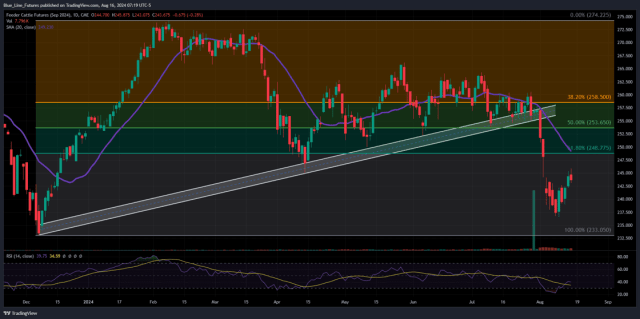
Like live cattle, feeder cattle attempted to rally yesterday before reversing to finish the day lower. Wide ranging trades are to be expected as the dust continues to settle following the sharp selloff that started two weeks ago. We continue to be in the “sell rallies” camp, but there is still some upside recovery risk from these levels, so position sizing remains paramount.
- Resistance: 245.32-245.875*, 248.675-249.20
- Pivot: 242.15-242.22
- Support: 238.97-239.15, 236.57-236.75, 233.05-233.95*
Below: Daily chart of September feeder cattle that illustrates the accelerated selling pressure that took place following a break below trendline support. Also included is a set of Fibonacci retracements from this year’s trading range.
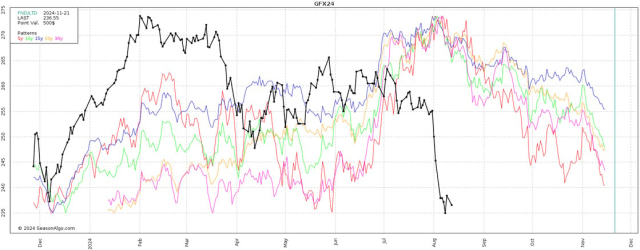
Seasonal Tendencies
Below is a look at prices averages for November feeder cattle over the last 5, 10, 15, 20, and 30 years. We are using November so you can see the longer trend as opposed to the front months which are on a much shorter time frame. As referenced many times last month, August can be a tricky year to stage a meaningful rally. Those headwinds start to subside some when we turn the calendar over to September, but that strength has often been short lived. *Past performance is not necessarily indicative of future results
Want to keep reading?
Subscribe to our daily Livestock Roundup for daily insights into Feeder Cattle, Live Cattle, and Lean Hogs technicals, including our proprietary trading levels, and actionable market bias.
Sign Up for Free Futures Market Research – Blue Line Futures
Futures trading involves substantial risk of loss and may not be suitable for all investors. Therefore, carefully consider whether such trading is suitable for you in light of your financial condition. Trading advice is based on information taken from trade and statistical services and other sources Blue Line Futures, LLC believes are reliable. We do not guarantee that such information is accurate or complete and it should not be relied upon as such. Trading advice reflects our good faith judgment at a specific time and is subject to change without notice. There is no guarantee that the advice we give will result in profitable trades. All trading decisions will be made by the account holder. Past performance is not necessarily indicative of future results.
Blue Line Futures is a member of NFA and is subject to NFA’s regulatory oversight and examinations. However, you should be aware that the NFA does not have regulatory oversight authority over underlying or spot virtual currency products or transactions or virtual currency exchanges, custodians or markets. Therefore, carefully consider whether such trading is suitable for you considering your financial condition.
With Cyber-attacks on the rise, attacking firms in the healthcare, financial, energy and other state and global sectors, Blue Line Futures wants you to be safe! Blue Line Futures will never contact you via a third party application. Blue Line Futures employees use only firm authorized email addresses and phone numbers. If you are contacted by any person and want to confirm identity please reach out to us at info@bluelinefutures.com or call us at 312- 278-0500
Performance Disclaimer
Hypothetical performance results have many inherent limitations, some of which are described below. No representation is being made that any account will or is likely to achieve profits or losses similar to those shown. In fact, there are frequently sharp differences between hypothetical performance results and the actual results subsequently achieved by any particular trading program.
One of the limitations of hypothetical performance results is that they are generally prepared with the benefit of hindsight. In addition, hypothetical trading does not involve financial risk, and no hypothetical trading record can completely account for the impact of financial risk in actual trading. For example, the ability to withstand losses or to adhere to a particular trading program in spite of trading losses are material points which can also adversely affect actual trading results. There are numerous other factors related to the markets in general or to the implementation of any specific trading program which cannot be fully accounted for in the preparation of hypothetical performance results and all of which can adversely affect actual trading results.
On the date of publication, Oliver Sloup did not have (either directly or indirectly) positions in any of the securities mentioned in this article. All information and data in this article is solely for informational purposes. For more information please view the Disclosure Policy here.
Disclaimer: The copyright of this article belongs to the original author. Reposting this article is solely for the purpose of information dissemination and does not constitute any investment advice. If there is any infringement, please contact us immediately. We will make corrections or deletions as necessary. Thank you.