Corn
Technicals (December)
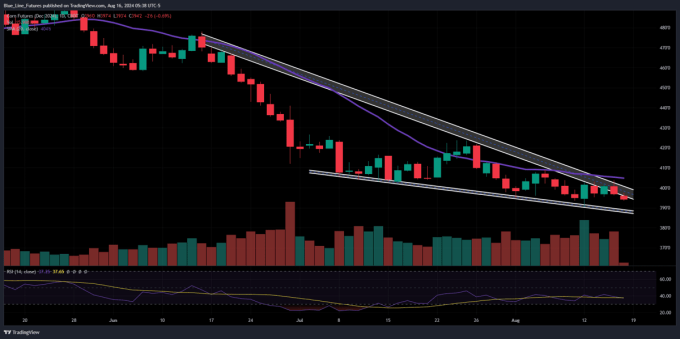
December corn futures were on the verge of a breakout above trendline resistance and the 20-day moving average, but that early morning strength faded and turned to weakens into the afternoon. That weakness has carried over into weakness in the early morning trade with December corn down 2 3/4 of a cent around 5:30am CT. Support below the market comes in from 387-390 1/4. The CME CVOL index (a measure of volatility) continues to drift lower, on the verge of reaching its lowest levels since February.
Short Term Bias and Technical Levels of Importance
- Bias: Neutral/Bullish
- Resistance: 406 1/4-409, 421 3/4-423 3/4*
- Pivot: 403 3/4-404 3/4
- Support: 387-390 1/4*, 380
Below: Daily Chart of December Corn Futures, depicting trendline resistance from the June highs as well as trendline support, both of which are converging to create a falling wedge. The chart also includes the 20-day moving average (in purple).
Notes
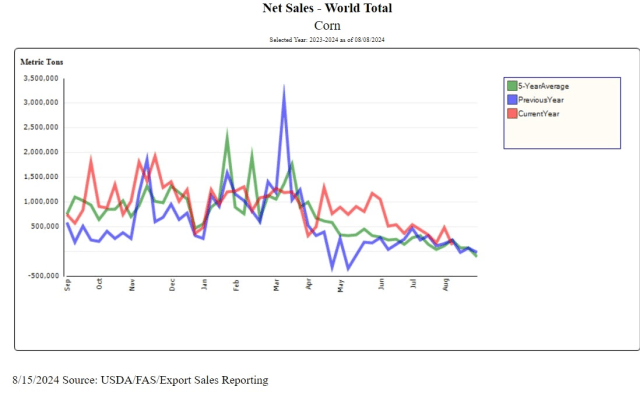
- Weekly Export Sales: Thursday’s weekly export sales report came in at 120,500 MT (4,743,874 bushels) for 2023/2024, below the low end of expectations and a marketing-year low. This was down 75 percent from the previous week and 66 percent from the prior 4-week average. Net sales of 800,500 MT (31,514,284 bushels) for 2024/2025 which was just a hair above the top end of expectations at 800k.
- Argentina: The Buenos Aires Grain Exchange left corn production unchanged from the prior week, 46.5m tons. Corn harvest is 97.8% complete.
- International Grains Council: IGC increased their 2024/2025 global corn production forecast to 1.226 billion MT, up 1mmt.
- Mississippi River: Barge shipments of corn rose 22.3% from the previous week. St. Louis barge rates saw an increase of $1.04 form the previous week to $15.04 per short ton.
Chart of Interest
Below is a visual representation of his year’s weekly export sales data (red line) relative to the previous year (blue line) and the 5-year average pace (green line).
Soybeans
Technicals (November)
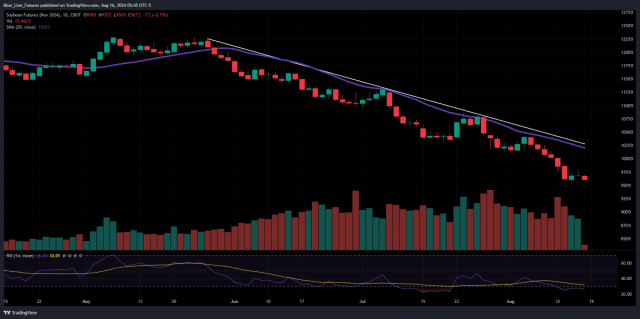
Soybeans attempted to rally in Thursday’s trade following a second consecutive week of better-than-expected new crop export sales. However, that early morning optimism stalled out against our pivot pocket from 975 1/2-980, with the market posting a high for the session at 978 1/4. Sellers stepped back in there which reversed prices and took them back near unchanged at the close. The reversal as continued into the overnight and early morning trade with November futures down 7 1/2 cents at about 5:30am CT. That pivot pocket will remain intact and act as a near term inflection point for the market. On the support side, we see minor support from 950-955 1/4.
Short Term Bias and Technical Levels of Importance
- Bias: Neutral/Bearish
- Resistance: 995-1000, 1013-1015
- Pivot: 975 1/2-980
- Support: 950-955 1/4**
Below: Daily Chart of November Soybean Futures, depicting trendline resistance from the May highs as well as the 20-day moving average (in purple).
Notes
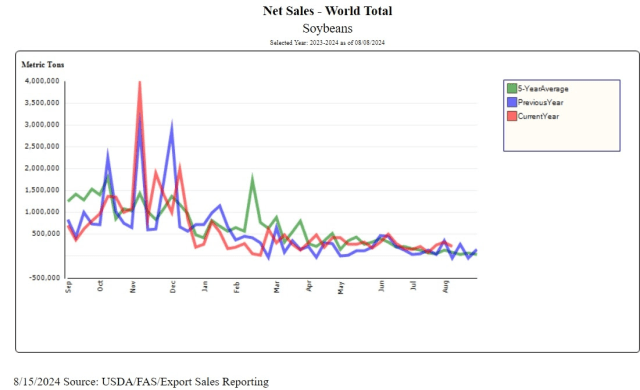
- Weekly Export Sales: Yesterday’s weekly export sales report came in at 221,700 MT (8,146,078 bushels) for 2023/2024, within the range of expectations but down 32 percent from the previous week and 1 percent from the prior 4-week average. Net sales of 1,344,200 MT (49,390,881 bushels) for 2024/2025, this is the second we week we saw new crop sales above the top end of expectations.
- NOPA Crush: NOPA crush was reported at 182.881 million bushels, which was above the average estimate and 5.5% over last year’s July record. Soy oil stocks at 1.499 billion lbs were below the average guess and at a 7-month low.
- International Grains Council: IGC increased their 2024/2025 global soybean production estimate to 419mmt, up 4mmt from last month. This is nearly 7% above last year’s record.
Mississippi River: Barge shipments of soybeans rose 25% week over week.
Chart of Interest
Below is a visual representation of his year’s weekly export sales data (red line) relative to the previous year (blue line) and the 5-year average pace (green line).
Want to keep reading?
Subscribe to our daily Grain Express for daily insights into Soybeans, Wheat, and Corn technicals, including our proprietary trading levels, and actionable market bias by claiming your free two-week trial!
Sign Up for Free Futures Market Research – Blue Line Futures
Futures trading involves substantial risk of loss and may not be suitable for all investors. Therefore, carefully consider whether such trading is suitable for you in light of your financial condition. Trading advice is based on information taken from trade and statistical services and other sources Blue Line Futures, LLC believes are reliable. We do not guarantee that such information is accurate or complete and it should not be relied upon as such. Trading advice reflects our good faith judgment at a specific time and is subject to change without notice. There is no guarantee that the advice we give will result in profitable trades. All trading decisions will be made by the account holder. Past performance is not necessarily indicative of future results.
Blue Line Futures is a member of NFA and is subject to NFA’s regulatory oversight and examinations. However, you should be aware that the NFA does not have regulatory oversight authority over underlying or spot virtual currency products or transactions or virtual currency exchanges, custodians or markets. Therefore, carefully consider whether such trading is suitable for you considering your financial condition.
With Cyber-attacks on the rise, attacking firms in the healthcare, financial, energy and other state and global sectors, Blue Line Futures wants you to be safe! Blue Line Futures will never contact you via a third party application. Blue Line Futures employees use only firm authorized email addresses and phone numbers. If you are contacted by any person and want to confirm identity please reach out to us at info@bluelinefutures.com or call us at 312- 278-0500
Performance Disclaimer
Hypothetical performance results have many inherent limitations, some of which are described below. No representation is being made that any account will or is likely to achieve profits or losses similar to those shown. In fact, there are frequently sharp differences between hypothetical performance results and the actual results subsequently achieved by any particular trading program.
One of the limitations of hypothetical performance results is that they are generally prepared with the benefit of hindsight. In addition, hypothetical trading does not involve financial risk, and no hypothetical trading record can completely account for the impact of financial risk in actual trading. For example, the ability to withstand losses or to adhere to a particular trading program in spite of trading losses are material points which can also adversely affect actual trading results. There are numerous other factors related to the markets in general or to the implementation of any specific trading program which cannot be fully accounted for in the preparation of hypothetical performance results and all of which can adversely affect actual trading results.
On the date of publication, Oliver Sloup did not have (either directly or indirectly) positions in any of the securities mentioned in this article. All information and data in this article is solely for informational purposes. For more information please view the Disclosure Policy here.
Disclaimer: The copyright of this article belongs to the original author. Reposting this article is solely for the purpose of information dissemination and does not constitute any investment advice. If there is any infringement, please contact us immediately. We will make corrections or deletions as necessary. Thank you.