by Brett Friedman, Winhall Risk Analytics, OptionMetrics Contributor
The recent sharp declines in the equity markets, marking the most significant flight to safety since the 2020 pandemic, likely came as no surprise to any investor following commodity markets. Since mid-2022, commodity prices have been in a sideways to negative trend. With only a few notable exceptions (such as Gold), and contrary to most predictions, this trend has accelerated downward since the beginning of summer. As of August 7, the Goldman Sachs Commodity Index (GSCI) and Bloomberg Commodity Index (BCOM) are 8.2% and 6.1% lower, respectively, than they were on July 1. Projections of slower economic growth, both domestically and in China, are usually cited as the reasons for the declines.
At the same time, the implied volatility of most commodities has been decreasing (as can be seen in the chart below), indicating the slow-speed nature of the decline as well as the market’s general torpor and complacency. Although various geopolitical events continue to simmer—and indeed threaten to boil over—the commodity markets seem uninterested. Previous warnings of severe supply disruptions failed to materialize, and now it appears that the markets require hard proof before rallying. The downward trend should not be ignored: lower worldwide commodity prices can be both a consequence and a driver of slower global growth and inflation.

Source: OptionMetrics
Despite the bearish overall trend, there is one notable exception: gold, and one that has been sold off but still has the potential to spike unexpectedly: crude oil.
First, Gold. Despite the amount of attention gold receives from the mainstream press and the number of online videos and blogs devoted to its every twist and turn, gold by itself is not a major component of the broad commodity indexes. For the Bloomberg Commodity Index (BCOM), it is 14.3%; for the Goldman Sachs Commodity Index (GSCI), it is 4.1% (BCOM relies more heavily on liquidity data). Nor is its trading volume particularly high. Even when combined with silver, copper, and platinum, its average daily trading volume on the CME is only about 31% of the energy complex. Also contrary to popular perception, gold isn’t exceptionally volatile, with daily price swings averaging about +/- $10 and an implied volatility that averages a little below 17%; the highest it ever reached was 62.3% on 10/29/2008. Compare that to crude oil (WTI), with a high implied volatility reading of just shy of 200%, or other commodities that regularly venture into triple digits (e.g., natural gas), and you can see that gold is a relatively quiet market.
Regardless of its relative importance in the commodity complex, the shiny metal has been on a consistent upswing since roughly Q4 2022 and most recently made new all-time highs on July 16. Investors have always viewed gold as a safe haven from uncertainty, and current economic and geopolitical conditions seem to support that view. Interestingly, gold did not perform as expected during the recent equity downturn but instead fell on the day, just like a typical risk asset in the midst of a potential panic. This points to the possibility that gold is now part of many investors’ diversified portfolios and may no longer perform as a safe haven during times of stress.

Source: OptionMetrics
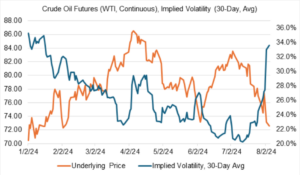
Crude oil, on the other hand, led the charge downward in July. Crude oil and the rest of the energy complex are the largest components of the GSCI (41.7%, 61.5%) and BCOM (15%, 30.1%) and are undisputedly a major factor in the world economy. For investors that don’t follow crude oil closely, its continued bearishness must come as a surprise given the constant drumbeat of war emanating from the Middle East. However, and at least so far, supply disruptions have been more theoretical than actual. That allows the market to focus on the demand side, and the economic picture is increasingly bearish from the US and China. July registered four consecutive weeks of decline, with WTI crude oil ultimately falling 4.7% for the month.

Source: OptionMetrics
The behavior of crude oil’s implied volatility in July was telling. As is the case with many other commodities and individual stocks, crude oil’s implied volatility moves inversely with its price. Normally, this could be attributed to greater return variability (volatility) at lower price levels. Although daily crude returns seem to be independent of price levels, traders’ anxieties are not. Rightly or wrongly, traders tend to view one direction as more dangerous and prone to volatility and instability than the other. Similar to equity markets, crude oil tends to suffer from memories of downside blowouts, such as on April 20, 2020, when crude settled in negative territory. This effect could be seen clearly in July. As prices declined sharply, crude’s implied volatility spiked almost 14 volatility points, from 20% to 33.6%. Of course, some of this had to do with the extreme volatility and uncertainty emanating from other asset classes, but declining price levels added to the situation.
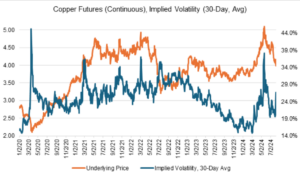
The behavior of crude oil implied volatility stands in contrast to that of copper, which is often used to gauge industrial demand. For most of this year, copper was the “AI of commodities” and deemed to be a crucial component of most aspects of renewable energy. Copper rallied consistently for most of 2024, eventually making new all-time highs in mid-May ($5.11). The market was apparently nervous that the rally was unsustainable, as implied volatility rallied along with copper itself, eventually peeking out at 38.1%. Soon after, the excitement wore off. Currently, copper is hovering in the $4.00 region and its implied volatility is back to a more normal 26.7%.

Source: OptionMetrics
Similar to the VIX index, crude oil, gold, and copper implied volatility can act as an uncertainty or fear index. This was evident during the most recent downturn as commodity markets responded to events also affecting equity, FX, and fixed income markets. However, since commodity markets had been declining sharply during July and are an indicator of future economic growth, to a certain extent, they telegraphed what could occur in other asset classes.
For more insights on the commodities and futures, the options market, and volatility, visit the OptionMetrics blog.
There is an inherent risk involved with financial decisions. The information in this article is for informational purposes only and is not intended to provide financial advice.
On the date of publication, OptionMetrics did not have (either directly or indirectly) positions in any of the securities mentioned in this article. All information and data in this article is solely for informational purposes. For more information please view the Disclosure Policy here.
Disclaimer: The copyright of this article belongs to the original author. Reposting this article is solely for the purpose of information dissemination and does not constitute any investment advice. If there is any infringement, please contact us immediately. We will make corrections or deletions as necessary. Thank you.


