Corn
Technicals (December)
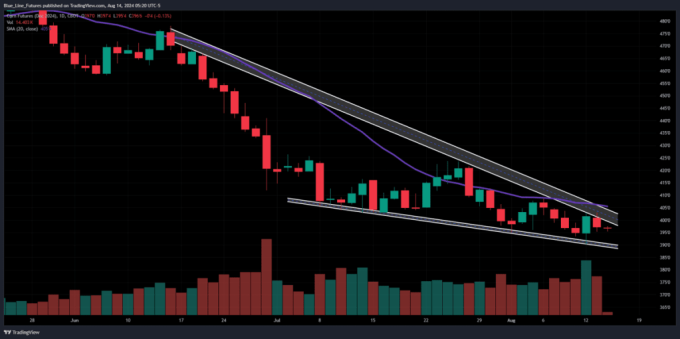
Corn futures gave back some ground in yesterday's session after failing to get out above trendline resistance. That resistance pocket is quickly converging with trendline support below the market, creating what many technicians refer to as a falling wedge pattern. This technical pattern is looked at by most technicians as Bullish as it illustrates the slowing of downward price momentum. The Bulls will want to see a break and close above resistance to confirm. A break and close below support would neutralize the chart setup.
Short Term Bias and Technical Levels of Importance
Bias: Neutral/Bullish (cautiously optimistic)
Resistance: 406 1/4-409, 421 3/4-423 3/4*
Pivot: 400-403
Support: 390 1/4, 380-385
Below: Daily Chart of December Corn Futures, depicting trendline resistance from the June highs as well as trendline support, both of which are converging to create a falling wedge. The chart also includes the 20-day moving average (in purple).
Notes
- Flash Sale Reported: On Tuesday morning, private exporters reported a flash sale of 137,160 metric tons (5,399,749 bushels) of corn for delivery to Mexico during the 2024/2025 marketing year
- CONAB: Brazil's equivalent of the USDA released their August corn production estimates on Tuesday morning, coming in at 115.65 MMT, down from 115.86 MMT in July.
- Ethanol: The EIA will release their weekly ethanol report this morning, analysts are expecting to see production tick up to 1.08 million barrels per day. The average estimate for stockpiles comes in at 23.846 million.
- Ukraine Production: Ukraine's 2024 corn harvest may fall to 20 to 21 million metric tons from around 30 million tons in 2023 if drought continues. Most of Ukraine experienced an abnormal heatwave in July, which producers expect will decrease the yield of late crops by around 30%. -Reuters
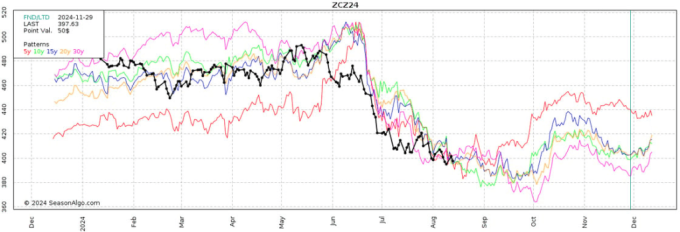
Seasonal Tendencies
Below is an updated look at price averages for December corn over 5, 10, 15, 20, and 30 years. *Past performance isn't necessarily indicative of future results.
Soybeans
Technicals (November)
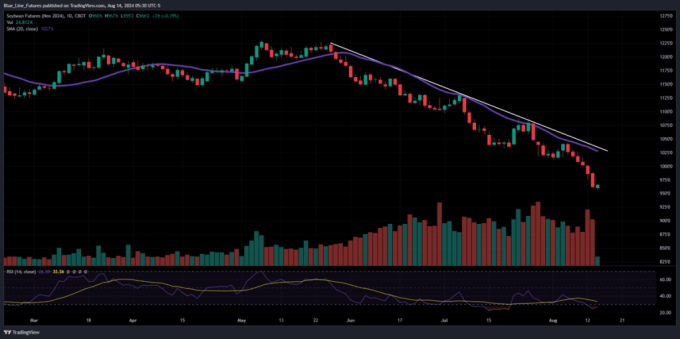
November soybean futures continued their descent in yesterday's trade, making new lows with ease. There was initial follow-through weakness overnight, but that has reversed some with prices trading about 4-5 cents higher around 5:30am CT. The last six sessions piled on top of what was a multitooth downtrend has turned the chart into a technical graveyard, leaving the Bulls with a lot of work to do to turn the tides. The RSI reached 24 and change yesterday, which is technically considered oversold, but we've seen that as low as 22 on a few different occasions this summer. On the resistance side, the first hurdle for the Bulls to get out above comes in from 975 1/2-980.
Short Term Bias and Technical Levels of Importance
Bias: Bearish/Neutral
Resistance: 995-1000, 1013-1015
Pivot: 975 1/2-980
Support: 950*
Below: Daily Chart of November Soybean Futures, depicting trendline resistance from the May highs as well as the 20-day moving average (in purple).
Notes
- Flash Sale Reported: On Tuesday morning, private exporters reported a flash sale of 132,000 metric tons (4,850,168 bushels) of soybeans for delivery to China during the 2024/2025 marketing year
- CONAB: Brazil's equivalent of the USDA released their August soybean production estimates on Tuesday morning, coming in at 147.38 MMT, up slightly from 147.34 MMT in July.
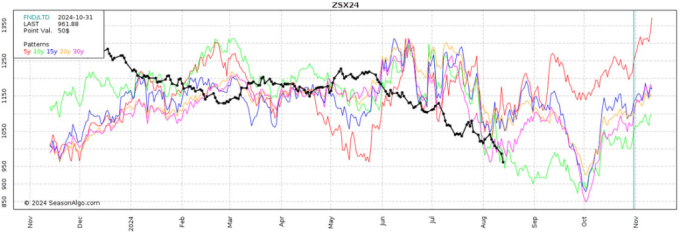
Seasonal Tendencies
Below is an updated look at price averages for November soybeans over 5, 10, 15, 20, and 30 years. *Past performance isn't necessarily indicative of future results.
Want to keep reading?
Subscribe to our daily Grain Express for daily insights into Soybeans, Wheat, and Corn technicals, including our proprietary trading levels, and actionable market bias by claiming your free two-week trial!
https://bluelinefutures.com/2023-signup/?utm_source=Oliver-Sloup-
Futures trading involves substantial risk of loss and may not be suitable for all investors. Therefore, carefully consider whether such trading is suitable for you in light of your financial condition. Trading advice is based on information taken from trade and statistical services and other sources Blue Line Futures, LLC believes are reliable. We do not guarantee that such information is accurate or complete and it should not be relied upon as such. Trading advice reflects our good faith judgment at a specific time and is subject to change without notice. There is no guarantee that the advice we give will result in profitable trades. All trading decisions will be made by the account holder. Past performance is not necessarily indicative of future results.
Blue Line Futures is a member of NFA and is subject to NFA’s regulatory oversight and examinations. However, you should be aware that the NFA does not have regulatory oversight authority over underlying or spot virtual currency products or transactions or virtual currency exchanges, custodians or markets. Therefore, carefully consider whether such trading is suitable for you considering your financial condition.
With Cyber-attacks on the rise, attacking firms in the healthcare, financial, energy and other state and global sectors, Blue Line Futures wants you to be safe! Blue Line Futures will never contact you via a third party application. Blue Line Futures employees use only firm authorized email addresses and phone numbers. If you are contacted by any person and want to confirm identity please reach out to us at info@bluelinefutures.com or call us at 312- 278-0500
Performance Disclaimer
Hypothetical performance results have many inherent limitations, some of which are described below. No representation is being made that any account will or is likely to achieve profits or losses similar to those shown. In fact, there are frequently sharp differences between hypothetical performance results and the actual results subsequently achieved by any particular trading program.
One of the limitations of hypothetical performance results is that they are generally prepared with the benefit of hindsight. In addition, hypothetical trading does not involve financial risk, and no hypothetical trading record can completely account for the impact of financial risk in actual trading. For example, the ability to withstand losses or to adhere to a particular trading program in spite of trading losses are material points which can also adversely affect actual trading results. There are numerous other factors related to the markets in general or to the implementation of any specific trading program which cannot be fully accounted for in the preparation of hypothetical performance results and all of which can adversely affect actual trading results.
On the date of publication, Oliver Sloup did not have (either directly or indirectly) positions in any of the securities mentioned in this article. All information and data in this article is solely for informational purposes. For more information please view the Disclosure Policy here.
Disclaimer: The copyright of this article belongs to the original author. Reposting this article is solely for the purpose of information dissemination and does not constitute any investment advice. If there is any infringement, please contact us immediately. We will make corrections or deletions as necessary. Thank you.