Corn
Technicals (December)
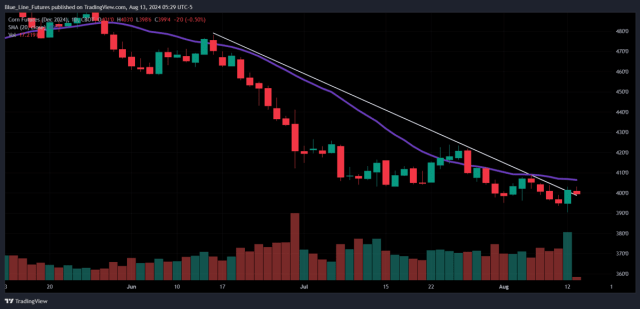
Corn was able to stage a nice little rally to start the week, making it the fourth consecutive Monday with a higher close. The headline yield number in yesterday’s report led to initial weakness but some of that was offset by lower harvested acres and carryout numbers that were below expectations. Today could be an important day for technical treaders as the market knocks on the door of trendline resistance and the 20-day moving average, those price points come in from 406 1/4-409. On the support side, a failure to defend 400-403 keeps the door open for more new lows.
Short Term Bias and Technical Levels of Importance
- Bias: Neutral/Bullish (cautiously optimistic)
- Resistance: 406 1/4-409, 421 3/4-423 3/4*
- Pivot: 400-403
- Support: 390 1/4, 380-385
Below: Daily Chart of December Corn Futures, depicting trendline resistance from the June highs as well as the 20-day moving average (in purple).
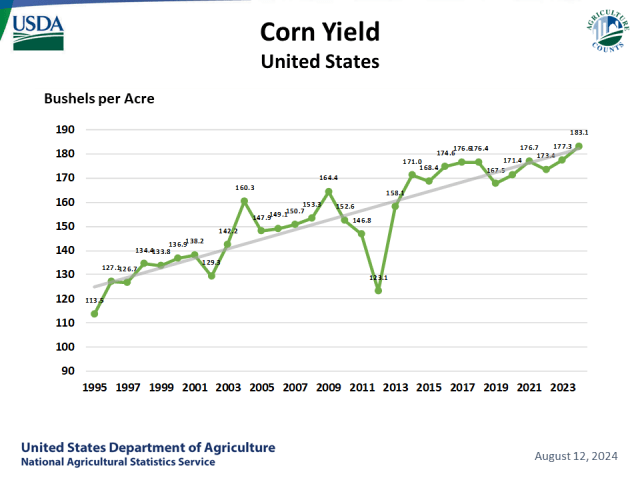
August 12th USDA Report Snapshot
- Production: 15.147 billion bushels
- Yield: 183.1 bushels per acre
- Harvested Acres: 82.71 million
- 23/24 Ending Stocks: 1.867 billion bushels
- 24/25 Ending Stocks: 2.073 billion bushels
Weekly Crop Progress Update
Monday afternoon’s crop progress report showed good/excellent conditions for the U.S. corn crop at 67%, unchanged from last week and 1% better than expectations. Last year at this time the crop was rated 59% good/excellent.

Other Notes From Monday
- Weekly Export Inspections: 974,677 Metric Tons, within the range of estimates from 900,000-1,300,000. Last week: 1,213,422.
- Flash Sale Reported: 165,000 metric tons (6,495,761 bushels) of corn for delivery to unknown destinations during the 2024/2025 marketing year.
Soybeans
Technicals (November)
Yesterday’s WASDE report confirmed what the market has been trying to price in, and that is that a big crop keeps getting bigger. The market made new lows following the release but was able to finish halfway decent. That sliver of optimism has waned overnight with the market taking out yesterday’s lows which marks the lowest levels since September of 2020. That pressure has taken the RSI down to 26, nearing the lowest levels we’ve seen all year. Last January and March we saw it as low as 20.
Short Term Bias and Technical Levels of Importance
- Bias: Bearish/Neutral
- Resistance: 1013-1015, 1025-1031 3/4
- Pivot: 995-1000
- Support: 980*
Below: Daily Chart of November Soybean Futures, depicting trendline resistance from the May highs as well as the 20-day moving average (in purple).

August 12th USDA Report Snapshot
- Production: 4.589 billion bushels
- Yield: 53.2 bushels per acre
- Harvested Acres: 86.271 million
- 23/24 Ending Stocks: 345 million bushels
- 24/25 Ending Stocks: 560 million bushels

Weekly Crop Progress Update
Good/excellent conditions for the U.S. soybean crop were left unchanged at 68%, that was 1% better than expectations. Last year at this time the crop was rated at 59% good/excellent.

Other Notes From Monday
- Flash Sale Reported: 300,000 metric tons (11,023,110 bushels) of soybeans for delivery to unknown destinations. Of the total, 100,000 metric tons is for delivery during the 2023/2024 marketing year and 200,000 metric tons is for delivery during the 2024/2025 marketing year.
- Weekly Export Inspections: 326,546 Metric Tons, within the range of estimates from 300,000-500,000. Last week: 261,203.
Wheat
Technicals (September)
September Chicago wheat futures have been tethered to the 20 day moving average for the last week, with significant overhead resistance coming in just above that from 555 1/2-556 1/4. Until we see consecutive closes above that pocket, the Bears will continue to have the technical advantage. On the support side, our first support pocket is being tested this morning, that comes in from 525 1/4-530. Below that the next line in the sand comes in from 514-517.
Short Term Bias and Technical Levels of Importance
- Bias: Neutral
- Resistance: 555 1/2-556 1/4, 590-592
- Pivot: 537-540
- Support: 525 1/4-530, 514-517*
Below: Daily Chart of September Wheat Futures, depicting resistance and a potential inflection point for the market from 555 1/2-556 1/4.

August 12th USDA Report Snapshot
- All Wheat Production: 1.982 billion bushels
- 24/25 Ending Stocks: 828 million bushels
Other Notes from Monday
- Spring wheat good/excellent ratings were reported at 72%, analysts were expecting it to be left unchanged at 74% from the previous week. Harvest is 18% complete.
- Winter wheat harvest is 93% complete, 2% ahead of the average pace.
Want to keep reading?
Subscribe to our daily Grain Express for daily insights into Soybeans, Wheat, and Corn technicals, including our proprietary trading levels, and actionable market bias by claiming your free two-week trial!
Sign Up for Free Futures Market Research – Blue Line Futures
Futures trading involves substantial risk of loss and may not be suitable for all investors. Therefore, carefully consider whether such trading is suitable for you in light of your financial condition. Trading advice is based on information taken from trade and statistical services and other sources Blue Line Futures, LLC believes are reliable. We do not guarantee that such information is accurate or complete and it should not be relied upon as such. Trading advice reflects our good faith judgment at a specific time and is subject to change without notice. There is no guarantee that the advice we give will result in profitable trades. All trading decisions will be made by the account holder. Past performance is not necessarily indicative of future results.
Blue Line Futures is a member of NFA and is subject to NFA’s regulatory oversight and examinations. However, you should be aware that the NFA does not have regulatory oversight authority over underlying or spot virtual currency products or transactions or virtual currency exchanges, custodians or markets. Therefore, carefully consider whether such trading is suitable for you considering your financial condition.
With Cyber-attacks on the rise, attacking firms in the healthcare, financial, energy and other state and global sectors, Blue Line Futures wants you to be safe! Blue Line Futures will never contact you via a third party application. Blue Line Futures employees use only firm authorized email addresses and phone numbers. If you are contacted by any person and want to confirm identity please reach out to us at info@bluelinefutures.com or call us at 312- 278-0500
Hypothetical performance results have many inherent limitations, some of which are described below. No representation is being made that any account will or is likely to achieve profits or losses similar to those shown. In fact, there are frequently sharp differences between hypothetical performance results and the actual results subsequently achieved by any particular trading program.
One of the limitations of hypothetical performance results is that they are generally prepared with the benefit of hindsight. In addition, hypothetical trading does not involve financial risk, and no hypothetical trading record can completely account for the impact of financial risk in actual trading. For example, the ability to withstand losses or to adhere to a particular trading program in spite of trading losses are material points which can also adversely affect actual trading results. There are numerous other factors related to the markets in general or to the implementation of any specific trading program which cannot be fully accounted for in the preparation of hypothetical performance results and all of which can adversely affect actual trading results.
On the date of publication, Oliver Sloup did not have (either directly or indirectly) positions in any of the securities mentioned in this article. All information and data in this article is solely for informational purposes. For more information please view the Disclosure Policy here.
Disclaimer: The copyright of this article belongs to the original author. Reposting this article is solely for the purpose of information dissemination and does not constitute any investment advice. If there is any infringement, please contact us immediately. We will make corrections or deletions as necessary. Thank you.