Tonight’s grain trade is called higher, with soybeans 2-4 cents higher, while corn looks at a gain of 1-2 cents higher and wheat 1-3 cents higher. Dry weather for the Central US and the reversal of the Japanese carry trade produced selling in the stock market and buying back of the short grain trade with weakness in the US dollar from last week’s financial data.
Last week, the Bank of Japan raised its interest rates for the first time in 25 years, beginning to unwind the Japanese carry trade. This was exasperated by Friday’s disappointing employment data, which indicated that the Federal Reserve is way behind the curve on lowering interest rates to prevent a US recession. The US dollar on Friday fell through daily and weekly chart-based support that could further enhance technical selling, softening the dollar, which helps improve exports.
Friday’s Commitment of Traders report showed that managed money still holds a short grain position of 580,000 contracts, a gain of 8,000 since last Tuesday. Late last week and likely into this week, funds will trim their short positions ahead of the August 12 WASDE crop report.
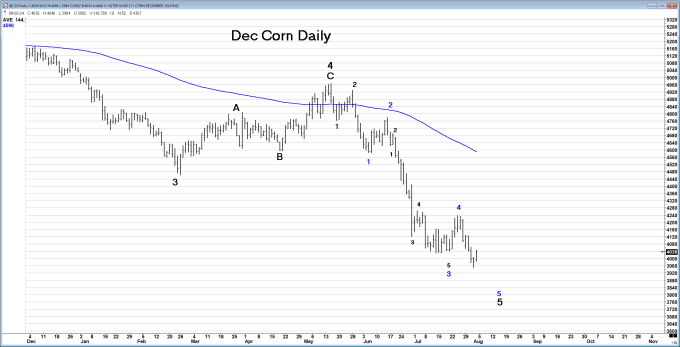
The WASDE crop report will likely indicate record yield potential for corn and soybeans, but the FSA data is possibly setting up a big surprise. The prospects of Preventive Plant and harvestable acres being lowered by more than 1 million acres on corn and nearly a million acres of soybeans are becoming a very real prospect. This will keep carryouts from growing much, and, in the case of corn, it could keep the carryout close to 2 Bil Bu despite utilizing yields north of 182 BPA. In fact, the USDA may be off on exports by a factor of 300-400 Mil Bu as the export season gets underway for new crop, due to crop shortfalls in Argentina/Brazil/Ukraine and crop production issues in China, where our carryout could be pushed back under 1.8 Bil Bu, indicating corn pricing near $4.00 or below is much too low. Contrary to many opinions that just want to focus on domestic US production as the pricing mechanism.
Ukraine and South American corn premiums continue to increase over US Gulf prices, improving US corn’s position in the global marketplace. Even ethanol plant revenues continue to remain at or slightly above all costs. Ukraine's market has moved from a transition of trying to find demand to rationing in a matter of weeks. According to many reports, the drought that has inundated Ukrainian corn production has a yield potential 35% below trend. Even China’s new dilemma with flooding in some of its key corn regions with moisture well over 200% of normal is making cheap US corn very inviting. FOB premiums in South America and Ukraine continue their rally, and the Brazilian cash market is unwilling to steal market share from the US between August through December. Even though a massive US harvest is eminent, supplies will disappear quickly until next year’s South American crops are harvested.
Soybeans and soybean meal are starting to find support as August meal last week produced the highest close since late May, while deferred meal contracts marked steady weekly closes. China has appeared again this past week, starting a soybean campaign that should continue to build in the coming months and possibly accelerating into the presidential elections. Meanwhile, we’ve seen 16 Senators urge US Treasury Secretary Yellen to quickly approve 40 5Z, the clean fuel tax credit, to use US ag products in the production of biofuels. They urged US independence in feedstock production and usage. China’s demand has been slow to develop but could quickly escalate. Brazil has been absent of any moisture now for a month in the largest soybean-producing areas, with forecasts still arid. Planting in Brazil for soybeans typically gets underway in the north in September.
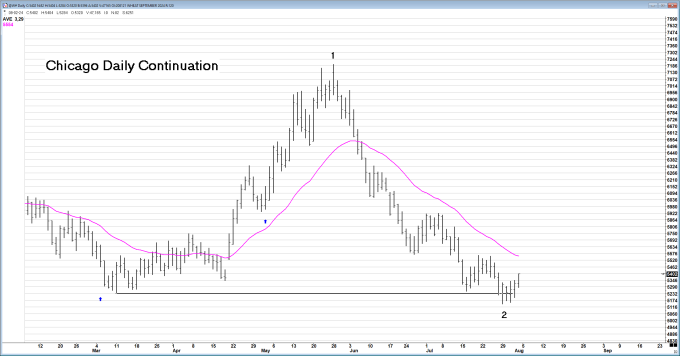
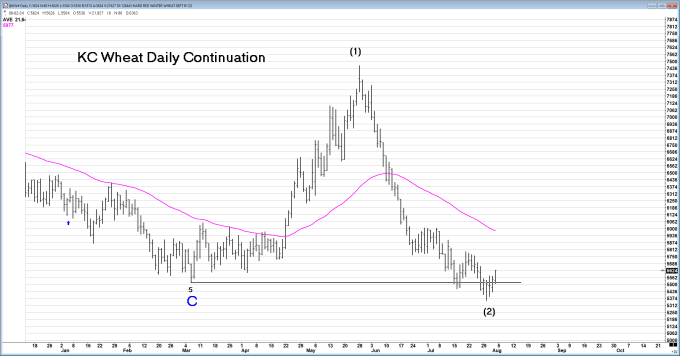
Wheat futures ended the week higher as the French winter wheat harvest reached 67%, and the US wheat harvest was already near 90% this weekend. North American high-protein wheat will be highly sought after this fall and winter as more is known about quality woes in Europe, along with developing spring wheat quality issues across central Russia manifest themselves. Managed money has a combined net wheat short of 118,000 contracts in Chicago and Kansas City as the seasonality of a price bottom gets close at hand and a strong seasonal upturn in price manifests by mid-September. An exit strategy for the short wheat trade, especially with the yen carry trade at risk, is becoming short in time.
A combined world wheat production loss of 20-24 MMTs worldwide has occurred, with 12-14 MMTs from the Black Sea region (Russia and Ukraine combined) and 8-10 MMTs of the EU wheat. Also, the dryness in Argentina should not be missed in all this. There is little doubt that the global cash supplies for fall into early winter are down sharply. SRW wheat is the cheapest in the world, and now Gulf HRW wheat is nearly on par with the German market for the first time since August 2022. It’s anticipated that China will likely import at least 12 MMTs of wheat this coming season on its WTO Ascension agreement, which is required, compared to last year’s import of 14 MMTs of world wheat.
This week’s coming weather will feature tropical storm Debbie, which is forecasted to make landfall by 2 PM ET across the Big Bend of Florida as a Cat 1 hurricane. The influence of Debbie will produce limited rainfall across the S and C Plains along with the Midwest and Delta over the next 7-9 days. Moisture will be pulled easterly as it exits through Georgia and North Carolina. Any meaningful rain will be confined to the N Plains and Great Lakes states with totals of .5-2.50”. Cooling will arrive across the N Plains and N Midwest this week, with heat forecast to return in the last half of August.
A higher start is anticipated this evening for the grain trade; maintaining strength in the early morning hours is the first sign of success, with avoiding selling during the day session that typically wrecks overnight rallies. If we close higher on Monday, maintaining most of the evening strength, a strong sign of an intermittent low in place for grain values is likely set until the August 12 crop report is behind us.
|