Oliver Sloup was on RFD-TV Monday morning, sharing his thoughts on the recent price action in the grain and livestock markets!
Corn
Technicals (December)
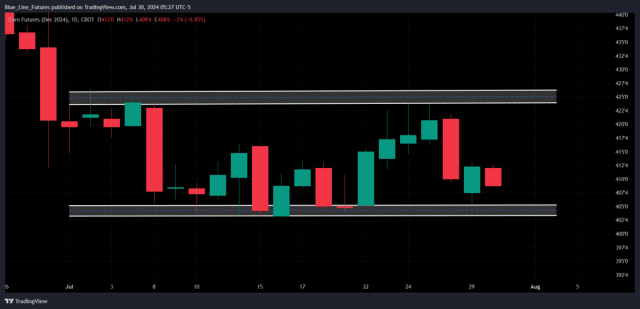
Corn futures had an impressive reversal yesterday, posting lows of the session on the open and highs at the close. Unfortunately for the corn Bulls, a better than expected crop progress report has stonewalled any follow-through in the overnight and early morning trade. Support from 399-403 remains intact and is what we would refer to as MUST HOLD territory on a closing basis. A failure there and we could see selling accelerate. On the resistance side, our pivot pocket from 413-416 1/2 is the hurdle the Bulls want to get back out above, that was tested to a T in yesterday’s trade.
Export Inspections: 1,058,922 metric tons. Above last week’s 991,257 MT. Current marketing year to date stands at 46,662,924 MT, VS the previous marketing year to date 34,824,070 MT.
Crop Progress: Good/excellent conditions of the U.S. corn crop were reported at 68%, that was a 1% improvement from the previous week. Many analysts were looking for a 1% decline.
- Bias: Neutral
- Resistance: 423-426, 430-434**
- Pivot: 413-416 1/2
- Support: 399-403**
Below is a daily chart of December corn futures.
Soybeans
Technicals (November)
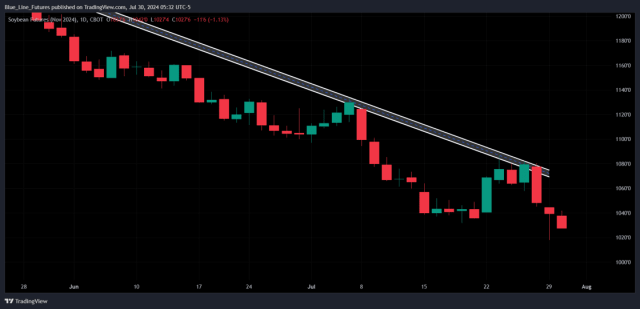
November soybean futures were under heavy pressure yesterday morning but were able to attract buying interest that propelled prices roughly 20 cents off the low. So far in the overnight and early morning trade that positive momentum has dissipated with futures trading within a dime of yesterday’s low. Today’s pivot pocket comes in from 1025-1031 3/4. The Bulls will want to defend this through today’s close. A failure to do so keeps the door open for a drop into the single digits.
Weekly Export Inspections: 403,268 metric tons. Above last week’s 338,225 MT. Current marketing year to date stands at 42,764,550 MT, VS the previous marketing year to date 50,517,104 MT.
Crop Progress: Good/excellent conditions for the U.S. soybean crop were reported at 67%, that was a 1% drop from the previous week and in line with the average estimate.
- Bias: Neutral
- Resistance: 1046-1050, 1061 1/2-1062 3/4
- Pivot: 1025-1031 3/4
- Support: 1000**
Below is a daily chart of November soybean futures
Want to keep reading?
Subscribe to our daily Grain Express for daily insights into Soybeans, Wheat, and Corn technicals, including our proprietary trading levels, and actionable market bias.
https://bluelinefutures.com/2023-signup/?utm_source=Oliver-Sloup-
Futures trading involves substantial risk of loss and may not be suitable for all investors. Therefore, carefully consider whether such trading is suitable for you in light of your financial condition. Trading advice is based on information taken from trade and statistical services and other sources Blue Line Futures, LLC believes are reliable. We do not guarantee that such information is accurate or complete and it should not be relied upon as such. Trading advice reflects our good faith judgment at a specific time and is subject to change without notice. There is no guarantee that the advice we give will result in profitable trades. All trading decisions will be made by the account holder. Past performance is not necessarily indicative of future results.
Blue Line Futures is a member of NFA and is subject to NFA’s regulatory oversight and examinations. However, you should be aware that the NFA does not have regulatory oversight authority over underlying or spot virtual currency products or transactions or virtual currency exchanges, custodians or markets. Therefore, carefully consider whether such trading is suitable for you considering your financial condition.
With Cyber-attacks on the rise, attacking firms in the healthcare, financial, energy and other state and global sectors, Blue Line Futures wants you to be safe! Blue Line Futures will never contact you via a third party application. Blue Line Futures employees use only firm authorized email addresses and phone numbers. If you are contacted by any person and want to confirm identity please reach out to us at info@bluelinefutures.com or call us at 312- 278-0500
Hypothetical performance results have many inherent limitations, some of which are described below. No representation is being made that any account will or is likely to achieve profits or losses similar to those shown. In fact, there are frequently sharp differences between hypothetical performance results and the actual results subsequently achieved by any particular trading program.
One of the limitations of hypothetical performance results is that they are generally prepared with the benefit of hindsight. In addition, hypothetical trading does not involve financial risk, and no hypothetical trading record can completely account for the impact of financial risk in actual trading. For example, the ability to withstand losses or to adhere to a particular trading program in spite of trading losses are material points which can also adversely affect actual trading results. There are numerous other factors related to the markets in general or to the implementation of any specific trading program which cannot be fully accounted for in the preparation of hypothetical performance results and all of which can adversely affect actual trading results.
On the date of publication, Oliver Sloup did not have (either directly or indirectly) positions in any of the securities mentioned in this article. All information and data in this article is solely for informational purposes. For more information please view the Disclosure Policy here.
Disclaimer: The copyright of this article belongs to the original author. Reposting this article is solely for the purpose of information dissemination and does not constitute any investment advice. If there is any infringement, please contact us immediately. We will make corrections or deletions as necessary. Thank you.