- Monday, January 15 is another US holiday, giving us an opportunity to take one last look back at USDA's data dump last Friday.
- Much was said and written over the weekend, most of it trying to make the perm-bulls in agriculture feel better about markets.
- The reality, though, is real fundamentals aren't always bullish.
As most of you know, I will be the last person in the industry defending monthly USDA WASDE reports. If it were up to me, these would’ve been done away with decades ago. As I’ve talked about more times than I can count, these reports are not about fundamentals, transparency, or evening the playing field. These reports are about generating trade volume. That’s all. And as we can see from this past Friday’s trade volume numbers in grains, the folks at USDA could raise a toast to another job well done.
That being said, I continue to be amazed and amused by the commentary I’ve seen in relation to the plethora of numbers released at the end of last week. Here is a small list of some of what I saw over the weekend:
- Production numbers (corn and soybeans, US and Brazil) didn’t fit with what many were hearing from customers.
- National average corn yield: “Nobody” saw the increase to 177 bushels per acre coming (bpa).
- The game is rigged. Fundamentals don’t matter anymore.
The first one is easy to dispel. When we hear folks talking about how markets aren’t moving with what folks are reporting their situation to be, think about Credence Clearwater Revivals song, “Lookin’ Out My Backdoor”[i]. There are too many great lyrics to repeat here (e.g., “Tambourines and elephants are playin’ in the band/Won’t you take a ride on the flyin’ spoon?”), but I can summarize with the close, “Doo, doo, doo, looking’ out my back door”.
When we see absolutes like “Nobody” tossed around to make a point, we know the argument is flawed. The Vodka Vacuity tells us there are no Absoluts when it comes to market analysis. That being said, did we know US national average yield was 177 bpa? Someone likely had that number on their Keno card, after all USDA’s number isn’t real, but rather pulled out of a hat somewhere. Those who take the time to follow corn’s REAL fundamentals did know production was larger.
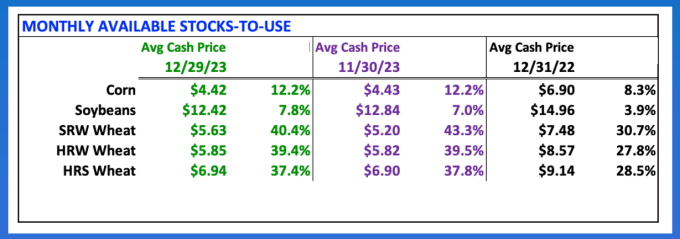
At the end of December, the National Corn Price Index (ICY00), a national average cash price, was calculated at $4.42 as compared to the previous December’s final figure of $6.90. Based on my Unknown Variable Solution[ii] we could see available stocks-to-use had grown from last year’s 8.3% to 12.2%. We also knew last February December corn had bought acres away from November soybeans, so production was likely to be larger in 2023[iii]. Since harvest, with demand (at least feed and exports) getting stronger, basis continues to run near its previous 5-yearl low weekly closes. Why would this be? Obviously merchandisers have plenty of supplies on hand to meet demand (again, available stocks-to-use).
The final talking point is the most common. It’s a way of explaining a non-bullish reaction by traders to a clientele that only wants to hear their markets are bullish. In other words, most everyone in agriculture. As I was putting this together I saw a teaser for another piece that said, “There has to be something bullish about grains…”. In all fairness, there is. Funds, the scapegoat for ag perma-bulls, are holding net-short futures positions[iv] in all the major grain and oilseed markets, opening the door to a possible round of short covering buying at any time.
Is the game rigged? Do funds actually control the market? These are two different questions. I’ve been around long enough to say the first is a strong possibility. But this isn’t anything new. Why do you think USDA releases its ag reports during trading hours, the only data dump we can say this about? To generate trade volume, of course.
Do funds control the market? Think back to my Market Rule #1: Don’t get crossways with the trend. Why? Newton’s First Law of Motion applied to markets tells us, “A trending market will stay in that trend until acted upon by an outside force, with that outside force usually noncommercial activity.” In other words, funds control the trend, but at some point funds have to answer to fundamentals[v]. Rule #6 tells us, “Fundamentals win in the end.” By this I do not mean, have never meant USDA’s imaginary version of supply and demand. I’m talking about REAL market fundamentals: cash price, basis, and futures spreads. My friend Tregg Cronin used to present on Grains’ Golden Rule, “First basis, then spreads, the futures”.
A look at national average basis for the 5 major grain and oilseed markets (corn, soybeans, 3 wheat classes) shows them all to be running below previous 5-year averages. Soybeans are just below average (fitting with decreased US production), corn is just above its previous 5-year lows, both winter wheat markets are far below previous 5-year lows, and HRS wheat is running near average. Here’s the setup:
- Basis is weak despite futures being under pressure.
- Futures are under pressure because funds have created net-short positions.
- Funds are holding net-short futures positions because real fundamentals are bearish.
- Real fundamentals are led by basis, which remains weak.
Watson[vi] has evolved a great deal over the past 20 years or so. In the mid-2000s, headlines were the dominant algorithm trade trigger. But as I’ve talked about many times over the years, funds realized the importance of real fundamentals and have grown the private industry of gathering meaningful supply and demand data, leaving everyone else to feast on government fodder.
In the end, then, fundamentals probably have more influence over funds than the industry has seen in the past. The problem, for most people anyway, is reality isn’t always bullish. That’s what we learned last Friday.
[i] I call this the CCR Reality.
[ii] This isn’t as complicated as it seems. To solve for stocks-to-use, the bottom-line supply and demand statistic, without knowing actual supply or demand numbers, we can use Economics 101 that teaches us the intersection of the supply and demand lines gives us market price. Therefore, if we know market price (national average cash price), we can then calculate available stocks-to-use anytime we choose.
[iii] My analysis of the Nov soybean/Dec corn spread has projected acreage changes correctly 13 out of the past 14 years. My study tracks the futures spread from September through February.
[iv] Another touchy subject. As you know, I track the CFTC Legacy/Futures Only Commitments of Traders reports. Why? A number of reasons, simplicity at the top of the list. We also have to keep in mind option traders trade for a lot of reasons besides being bullish or bearish.
[v] Funds versus Fund-amental-s: It’s “a mental” thing.
[vi] My name for computer algorithm trade that dominates the noncommercial position.
More Grain News from
- Sunday Scaries: What I'm Watching This Week In The Grain Markets
- Double Digit Losses for Corn Futures into 3-Day Weekend
- New Crop Beans Hold +$12 for Close
- Wheat Fades On NASS Stocks Data
On the date of publication, Darin Newsom did not have (either directly or indirectly) positions in any of the securities mentioned in this article. All information and data in this article is solely for informational purposes. For more information please view the Disclosure Policy here.
Disclaimer: The copyright of this article belongs to the original author. Reposting this article is solely for the purpose of information dissemination and does not constitute any investment advice. If there is any infringement, please contact us immediately. We will make corrections or deletions as necessary. Thank you.