Live Cattle
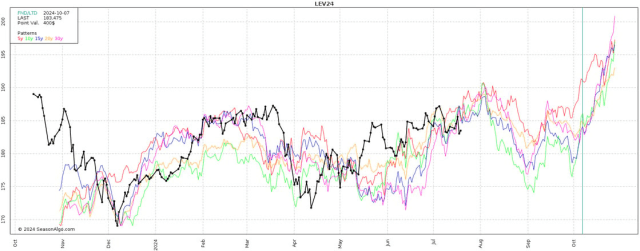
Technicals (October – V) October live cattle were able to surge higher yesterday on the back of August futures narrowing the gap with the cash trade. If this momentum and conversion continues, we could see October futures retest the top end of the range that dates back to March, 187.60-188.55. Below is an hourly chart of October live cattle, dating back to that March high. Seasonal weakness into August (as depicted in the second chart below has us leaning on the bearish side against resistance. A clean break and close above resistance would neutralize that bias.
Cash trade was pretty mute yesterday. Cutouts were softer with choice cuts down .23 to 313.21 and select cuts down 1.67 to 296.66. Daily slaughter was reported at 123k head.
Resistance: 187.60-188.55
Pivot: 185.77-185.87
Support: 181.725-182.25**, 179.60
Below: Hourly chart of October live cattle, dating back to the first week of March.

Below: Seasonal Tendencies for October live cattle. Past performance is not necessarily indicative of future results.
Feeder Cattle
Technicals (August – Q) August feeder cattle futures were able to stage a nice one-day rally in yesterday’s trade, whether or not we will see follow-through is still TBD. If the Bulls can get out above last week’s highs near 260, we would be looking for a retest of trendline resistance which comes in from 262.25-263.30.
Resistance: 259.65-260.25, 262.25-263.00*
Pivot: 256.125-256.70
Support: 253.40-254.35*, 250.80-251.125
Below: Daily chart of August feeder cattle, dating back to November.

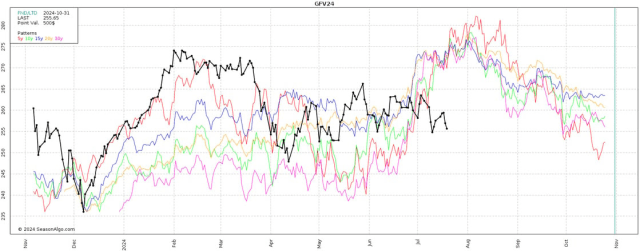
Below: Seasonal Tendencies for September feeder cattle. Past performance is not necessarily indicative of future results.
Lean Hogs
Technicals (October – V) A V bottom has propelled October lean hogs higher for 8 of the last 9 sessions, taking prices back to trendline resistance and our 4-star resistance pocket from 76.50-77.25 (the market settled at 77.125). If you’ve been long the market from lower prices you may consider reducing exposure at these levels. With that said, if the Bulls can keep the momentum going and close above 78.75, the next significant resistance would come in from 81.80-82.00.
Resistance: 78.75, 81.80-82.00**
Pivot: 76.50-77.25
Support: 74.55-75.00, 72.42-72.475

Want to keep reading?
Subscribe to our daily Livestock Roundup for daily insights into Feeder Cattle, Live Cattle, and Lean Hogs technicals, including our proprietary trading levels, and actionable market bias.
Sign Up for Free Futures Market Research - Blue Line Futures
Futures trading involves substantial risk of loss and may not be suitable for all investors. Therefore, carefully consider whether such trading is suitable for you in light of your financial condition. Trading advice is based on information taken from trade and statistical services and other sources Blue Line Futures, LLC believes are reliable. We do not guarantee that such information is accurate or complete and it should not be relied upon as such. Trading advice reflects our good faith judgment at a specific time and is subject to change without notice. There is no guarantee that the advice we give will result in profitable trades. All trading decisions will be made by the account holder. Past performance is not necessarily indicative of future results.
Blue Line Futures is a member of NFA and is subject to NFA’s regulatory oversight and examinations. However, you should be aware that the NFA does not have regulatory oversight authority over underlying or spot virtual currency products or transactions or virtual currency exchanges, custodians or markets. Therefore, carefully consider whether such trading is suitable for you considering your financial condition.
With Cyber-attacks on the rise, attacking firms in the healthcare, financial, energy and other state and global sectors, Blue Line Futures wants you to be safe! Blue Line Futures will never contact you via a third party application. Blue Line Futures employees use only firm authorized email addresses and phone numbers. If you are contacted by any person and want to confirm identity please reach out to us at info@bluelinefutures.com or call us at 312- 278-0500
Hypothetical performance results have many inherent limitations, some of which are described below. No representation is being made that any account will or is likely to achieve profits or losses similar to those shown. In fact, there are frequently sharp differences between hypothetical performance results and the actual results subsequently achieved by any particular trading program.
One of the limitations of hypothetical performance results is that they are generally prepared with the benefit of hindsight. In addition, hypothetical trading does not involve financial risk, and no hypothetical trading record can completely account for the impact of financial risk in actual trading. For example, the ability to withstand losses or to adhere to a particular trading program in spite of trading losses are material points which can also adversely affect actual trading results. There are numerous other factors related to the markets in general or to the implementation of any specific trading program which cannot be fully accounted for in the preparation of hypothetical performance results and all of which can adversely affect actual trading results.
On the date of publication, Oliver Sloup did not have (either directly or indirectly) positions in any of the securities mentioned in this article. All information and data in this article is solely for informational purposes. For more information please view the Disclosure Policy here.
Disclaimer: The copyright of this article belongs to the original author. Reposting this article is solely for the purpose of information dissemination and does not constitute any investment advice. If there is any infringement, please contact us immediately. We will make corrections or deletions as necessary. Thank you.