Corn
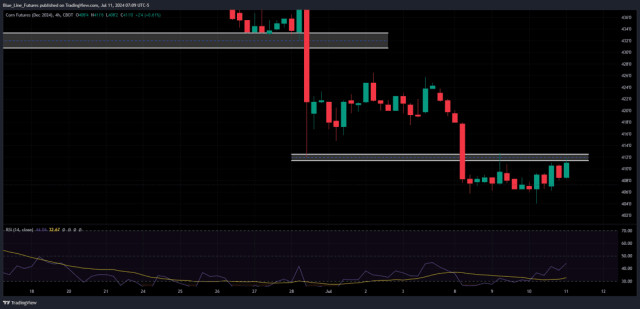
Technicals (December) Corn futures fell flat yesterday but are attempting to find their footing in the early morning trade with prices rallying up near our pivot pocket from 412-412 3/4. Below is a 4-hour chart of December corn. As you can see, this pocket has been a bit of an inflection point since the quarterly report. If the Bulls can chew through and close above this pocket, it could spark some short covering and gravitate prices up towards our next resistance pocket near 420. As mentioned in our afternoon wrap-up video yesterday, we have not really seen peak panic or capitulation yet, but overall sentiment is mirroring what it was at the February lows, where we were able to carve out a short-term low. We remain cautiously optimistic that we can see a bounce from these levels but recognize it is a counter trend trade, so risk management via stops or options may be something to consider if you have a similar bias.
Weekly Export Sales: Net sales of 538,300 MT for 2023/2024 were up 51 percent from the previous week, but down 13 percent from the prior 4-week average. Net sales of 116,500 MT for 2024/2025.
- Bias: Neutral/Bullish
- Resistance: 420-422, 430-434**
- Pivot: 412-412 3/4
- Support: 398-400**
Soybeans
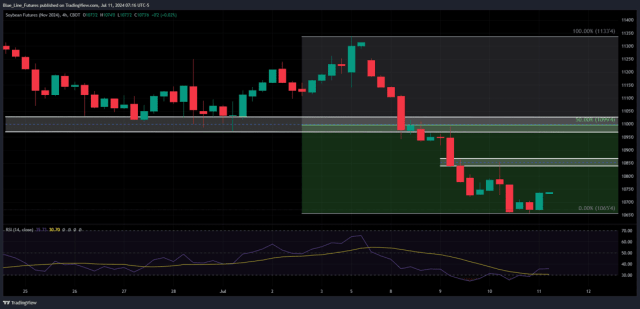
Technicals (November) November soybeans are higher in the early morning trade, but at this point traders may be taking the overnight action with an extra-large grain of salt. We did see a flash sale yesterday morning for new crop beans to China, the first of the year. Although a small amount and still well behind average pace, it is a silver lining and potential indication that low prices are curing low prices. From the technical perspective, the Bulls have their work cut out for them. The Bulls need to see prices get back out above our pivot pocket from 1085-1087 to spark additional short covering towards the technically and psychologically significant $11 handle. Below is a look at the 4-hour chart of November soybeans.
Weekly Export Sales: Net sales of 208,000 MT for 2023/2024 were down 9 percent from the previous week and 40 percent from the prior 4-week average. Net sales of 191,300 MT for 2024/2025
- Bias: Neutral/Bullish
- Resistance: 1097-1102, 1111 1/2-1115, 1138 1/2-1141**
- Pivot: 1085-1087
- Support: 1070-1071**
Want to keep reading?
Subscribe to our daily Grain Express for daily insights into Soybeans, Wheat, and Corn technicals, including our proprietary trading levels, and actionable market bias.
https://bluelinefutures.com/2023-signup/?utm_source=Oliver-Sloup-
Futures trading involves substantial risk of loss and may not be suitable for all investors. Therefore, carefully consider whether such trading is suitable for you in light of your financial condition. Trading advice is based on information taken from trade and statistical services and other sources Blue Line Futures, LLC believes are reliable. We do not guarantee that such information is accurate or complete and it should not be relied upon as such. Trading advice reflects our good faith judgment at a specific time and is subject to change without notice. There is no guarantee that the advice we give will result in profitable trades. All trading decisions will be made by the account holder. Past performance is not necessarily indicative of future results.
Blue Line Futures is a member of NFA and is subject to NFA’s regulatory oversight and examinations. However, you should be aware that the NFA does not have regulatory oversight authority over underlying or spot virtual currency products or transactions or virtual currency exchanges, custodians or markets. Therefore, carefully consider whether such trading is suitable for you considering your financial condition.
With Cyber-attacks on the rise, attacking firms in the healthcare, financial, energy and other state and global sectors, Blue Line Futures wants you to be safe! Blue Line Futures will never contact you via a third party application. Blue Line Futures employees use only firm authorized email addresses and phone numbers. If you are contacted by any person and want to confirm identity please reach out to us at info@bluelinefutures.com or call us at 312- 278-0500
Hypothetical performance results have many inherent limitations, some of which are described below. No representation is being made that any account will or is likely to achieve profits or losses similar to those shown. In fact, there are frequently sharp differences between hypothetical performance results and the actual results subsequently achieved by any particular trading program.
One of the limitations of hypothetical performance results is that they are generally prepared with the benefit of hindsight. In addition, hypothetical trading does not involve financial risk, and no hypothetical trading record can completely account for the impact of financial risk in actual trading. For example, the ability to withstand losses or to adhere to a particular trading program in spite of trading losses are material points which can also adversely affect actual trading results. There are numerous other factors related to the markets in general or to the implementation of any specific trading program which cannot be fully accounted for in the preparation of hypothetical performance results and all of which can adversely affect actual trading results.
On the date of publication, Oliver Sloup did not have (either directly or indirectly) positions in any of the securities mentioned in this article. All information and data in this article is solely for informational purposes. For more information please view the Disclosure Policy here.
Disclaimer: The copyright of this article belongs to the original author. Reposting this article is solely for the purpose of information dissemination and does not constitute any investment advice. If there is any infringement, please contact us immediately. We will make corrections or deletions as necessary. Thank you.