Short Term Elliott Wave in Oil (CL_F) shows incomplete Elliott Wave bearish sequence from 04.12.2024 high. Down from there, wave 1 ended at 76.15 like the 1 hour chart below shows. Rally in wave 2 unfolded in a zig zag Elliott Wave structure. Up from wave 1, wave ((a)) ended at 78.05 and dips in wave ((b)) ended at 77.68. Wave ((c)) higher ended at 80.63 which completed wave 2 in higher degree.
US Oil has resumed lower in wave 3. Down from wave 2, wave ((i)) ended at 76.39 and wave ((ii)) rally ended at 77.52. The CL_F then nested lower with wave (i) of ((iii)) ended at 76.62. Wave (ii) of ((iii)) ended at 77.34. The commodity extended lower in wave (iii) towards 72.48 and wave (iv) ended at 73.69. Wave (v) lower is still developing. As market stays below 73.69 high, we are calling for one more low to wave (v) of ((iii)) and wave ((iii)) in higher degree. Once wave ((iii)) ended, expect near term rally to fail in 3, 7, or 11 swing as wave ((iv)) for further downside.
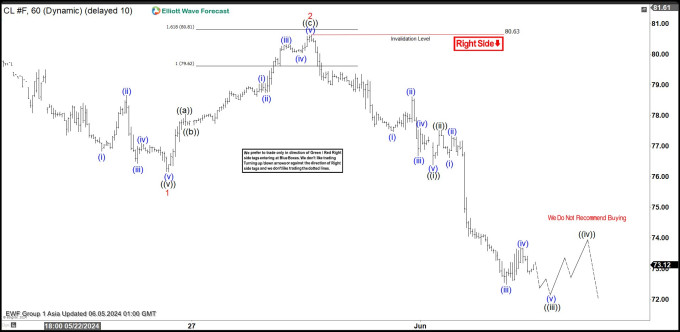
CL_F 60 Minutes Elliott Wave Chart
Source: https://elliottwave-forecast.com/commodities/elliott-wave-analysis-cl_f/
On the date of publication, Elliott Wave Forecast did not have (either directly or indirectly) positions in any of the securities mentioned in this article. All information and data in this article is solely for informational purposes. For more information please view the Disclosure Policy here.
Disclaimer: The copyright of this article belongs to the original author. Reposting this article is solely for the purpose of information dissemination and does not constitute any investment advice. If there is any infringement, please contact us immediately. We will make corrections or deletions as necessary. Thank you.