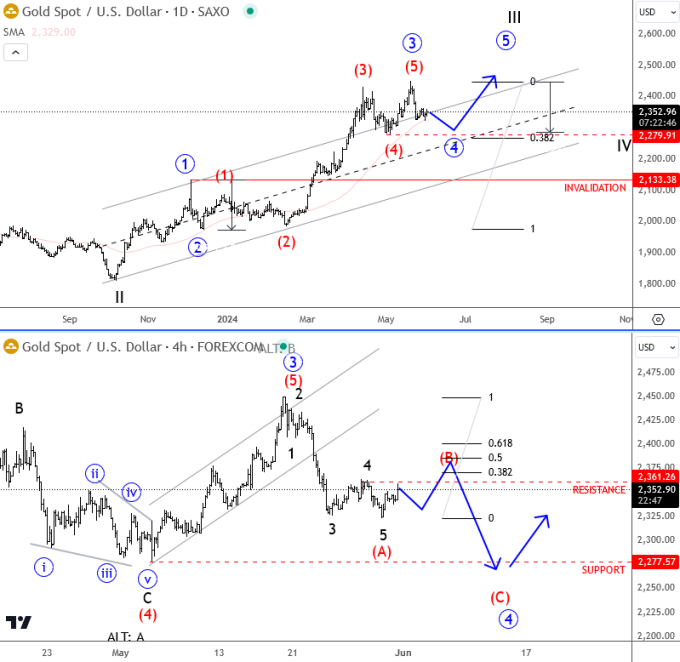
Gold is in a sharp recovery this year, displaying a robust rally since breaching the March highs of $2,133. The move shows no overlaps, indicating a clean and strong impulse, likely representing an extended third wave, with potential targets between $2,500 and $2,600.
Analyzing the daily time frame, and more closely on the 4-hour chart, there has been a strong push higher two weeks back. But, notice that break to new ATH has been temporary and that the price is now coming back below the 4-hour channel support and breaking the $2,372 swing area, suggesting a deeper correction might be in play, possibly made by three waves. Alternatively, the current impulse down from the high could also be wave C of a flat. Either way, it suggests that the decline is not over, but strong support could be found at $2,280, where bulls might show up again.
However, a lot will depend on the US yields and FED policy as well. Higher US yields could potentially cause more damage to metals, but if this is due to strong economic data and higher inflation, or hawkish FED, then any dip in gold could be short-lived, as many investors might look to the metal as an inflation hedge. On the other-hand, even if yields would come down if inflation softens, gold can find some buyers due to weak USD.
Grega
This article has been pulbished by wavetrades
On the date of publication, Gregor Horvat did not have (either directly or indirectly) positions in any of the securities mentioned in this article. All information and data in this article is solely for informational purposes. For more information please view the Disclosure Policy here.
Disclaimer: The copyright of this article belongs to the original author. Reposting this article is solely for the purpose of information dissemination and does not constitute any investment advice. If there is any infringement, please contact us immediately. We will make corrections or deletions as necessary. Thank you.