Tune in daily to catch Bill Baruch dissecting the day’s market happenings after the bell rings. Gain insightful analysis and stay ahead in the financial game with Bill as your guide!
Bill Baruch does a quick daily video after the market closes each day and posts it to his Twitter and Instagram: @bill_baruch.
E-mini S&P (June) / E-mini NQ (June)
S&P, yesterday’s close: Settled at 5328.00, down 17.25
NQ, yesterday’s close: Settled at 18,786.75, down 12.50
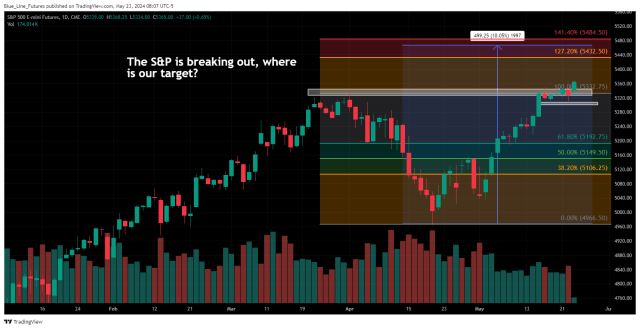
All eyes were on NVDA’s earnings report yesterday, but the E-mini NQ was already up more than 7% on the month. Despite that strength and a new record high, price action became stagnant in the week leading into this report. So much so that momentum and breadth began showing signs of exhaustion. A beat and raise from the market’s most powerful engine has revved indices, slinging the E-mini S&P and E-mini NQ further into fresh record territory and confirming what began a week ago: a breakout above the March high.
If the E-mini S&P and E-mini NQ were about to embark on a new bull leg, it is imperative for our first major three-star support levels, aligning with yesterday’s settlement, to hold. Furthermore, the E-mini S&P tested what we have had as rare major four-star support through the FOMC Minutes and again upon NVDA’s release. This level was also tested and held last Friday and brings a line in the sand defining the next bull leg at 5303.25-5308.50.
So, where to next? Two weeks ago, we wrote here that we believed the market began to confirm a bottom was created in April and through the first couple of days of May. We also expressed our upside target for this wave aligns multiple technical indicators with a Fibonacci retracement and a 10% run to 5459.75-5474.25. Today, we will use this moment to reiterate this target.
- Bias: Bullish
- Resistance: 5365.50-5370.50, 5391.75*, 5400-5420.25, 5459.75-5474.25
- Pivot: 5349
- Support: 5343.25-5345.25, 5334-5336.75, 5328, 5319.50*, 5303.25-5308.50
NQ (June)
- Resistance: 18,977**, 19,085, 19,319
- Pivot: 18,891
- Support: 18,786-18,825, 18,715-18,732, 18,678-18,691, 18,620-18,635*
Crude Oil (July)
Yesterday’s close: Settled 77.57, down 1.09
WTI Crude Oil futures are showing renewed life this morning, trading nearly 2% from the low through Asia’s open. In fact, commodities broadly were hit sharply during that timeframe. Soft economic data and hawkish Fed speak have been a headwind this week, but less of a draw than expected on yesterday’s weekly EIA inventory report and news that Russia overproduced in April brought additional market pressures.
Have we hit peak pessimism? WTI Crude Oil futures tested and responded to a significant area of support overnight, potentially building out the right shoulder of an inverse head and shoulders going back to May 8th. As today’s session unfolds into the final day of the week, we believe continued price action above our Pivot and point of balance at 78.08, the .382 retracement back to the 80.11 high, will help invite fresh buying.
- Bias: Neutral/Bullish
- Resistance: 78.33-78.47, 78.86-79.04, 79.34**, 80.09-80.11, 81.28
- Pivot: 78.08
- Support: 77.35-77.60, 76.63-76.82, 75.70-76.46*, 74.66-74.70
Gold (June) / Silver (July)
- Gold, yesterday’s close: Settled at 2392.9, down 33.0
- Silver, yesterday’s close: Settled at 31.496, down 0.582
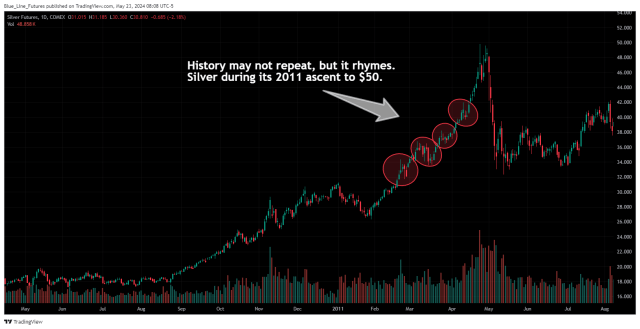
The metals complex was bludgeoned yesterday and given the late session selling, settlement prices do not do it justice. While risk management becomes more important than ever during times of uncertainty, pullbacks or corrections can last longer than one is comfortable, it is also equally as crucial to back out of the forest to see the trees. It is a time like this that I am reminded that during Silver’s path to $50 in 2011, there were multiple corrections of $3 or more. In February 2011, Silver broke out above its December high of 31.27 and on the third session, stretched to a high of 34.33 before consolidating a day and plunging to a low of 31.69. There were four instances like this before Silver peaked at 49.82 on April 25, 2011.
Yes, our Bias remains more Bullish, and it becomes imperative for Silver to have a constructive path and hold out above our two waves of rare major four-star support. The first aligns the April high with the .382 retracement back to the May low at 30.19-30.27. Last night’s low was 30.36. In the case of additional pressures, we will look to a critical area at 29.50-29.72. If that is surrendered, the bigger broader narrative is bending.
- Bias: Bullish/Neutral
- Resistance: 2375.2-2377.8, 2385.3, 2389.6-2392.9, 2398.9-2400, 2408, 2416.2-2417.4*
- Pivot: 2369.7-2370.6
- Support: 2356.8-2360.2, 2349.8, 2340.3-2343, 2322.5-2325.1
Silver (July)
- Resistance: 31.18, 31.28-31.32**, 31.50-31.61
- Pivot: 30.91-30.96
- Support: 30.63-30.73, 30.36-30.43, 30.19-30.27, 29.50-29.72
Micro Bitcoin (May)
- Yesterday’s close: Settled at 69,815, up 315
- Bias: Neutral/Bullish
- Resistance: 70,435-70,690, 71,000-71,250, 71,905-71,935, 74,100**, 75,795-76,200
- Pivot: 69,920
- Support: 69,000-69,405, 68,400, 67,365-68,035, 66,280-66,535**, 65,445
Connect With Bill!
https://bluelinefutures.com/2023-signup/?utm_source=Bill-Baruch-
Futures trading involves substantial risk of loss and may not be suitable for all investors. Therefore, carefully consider whether such trading is suitable for you in light of your financial condition. Trading advice is based on information taken from trade and statistical services and other sources Blue Line Futures, LLC believes are reliable. We do not guarantee that such information is accurate or complete and it should not be relied upon as such. Trading advice reflects our good faith judgment at a specific time and is subject to change without notice. There is no guarantee that the advice we give will result in profitable trades. All trading decisions will be made by the account holder. Past performance is not necessarily indicative of future results.
Blue Line Futures is a member of NFA and is subject to NFA’s regulatory oversight and examinations. However, you should be aware that the NFA does not have regulatory oversight authority over underlying or spot virtual currency products or transactions or virtual currency exchanges, custodians or markets. Therefore, carefully consider whether such trading is suitable for you considering your financial condition.
With Cyber-attacks on the rise, attacking firms in the healthcare, financial, energy and other state and global sectors, Blue Line Futures wants you to be safe! Blue Line Futures will never contact you via a third party application. Blue Line Futures employees use only firm authorized email addresses and phone numbers. If you are contacted by any person and want to confirm identity please reach out to us at info@bluelinefutures.com or call us at 312- 278-0500
Hypothetical performance results have many inherent limitations, some of which are described below. No representation is being made that any account will or is likely to achieve profits or losses similar to those shown. In fact, there are frequently sharp differences between hypothetical performance results and the actual results subsequently achieved by any particular trading program.
One of the limitations of hypothetical performance results is that they are generally prepared with the benefit of hindsight. In addition, hypothetical trading does not involve financial risk, and no hypothetical trading record can completely account for the impact of financial risk in actual trading. For example, the ability to withstand losses or to adhere to a particular trading program in spite of trading losses are material points which can also adversely affect actual trading results. There are numerous other factors related to the markets in general or to the implementation of any specific trading program which cannot be fully accounted for in the preparation of hypothetical performance results and all of which can adversely affect actual trading results.
On the date of publication, Bill Baruch did not have (either directly or indirectly) positions in any of the securities mentioned in this article. All information and data in this article is solely for informational purposes. For more information please view the Disclosure Policy here.
Disclaimer: The copyright of this article belongs to the original author. Reposting this article is solely for the purpose of information dissemination and does not constitute any investment advice. If there is any infringement, please contact us immediately. We will make corrections or deletions as necessary. Thank you.