Corn
Technicals (July)
July corn futures had a rough last week, pulling back as much as 24 1/2 cents after prices failed against our 4-star resistance pocket. Support on the way down was sliced through like a warm knife on butter which puts prices at an interesting place to start the week, sandwiched between the 50 and 100 day moving averages. Soybeans and wheat firming back up in the overnight and early morning trade may be helping to add a tailwind to prices. The Bulls want to see a close back above 460 1/4 to help neutralize some of the technical damage that was done last week.
Friday's Commitment of Traders report showed Funds were net buyers of roughly 31k futures and options contracts with a slight majority of that being new longs (vs short covering). Their net short position stands at 71,171 contracts.
Bias: Bullish/Neutral
Resistance: 460 1/4, 471-474 3/4, 483 1/2-486**
Pivot: 454 1/4-456 1/2
Support: 448-451**

Soybeans
Technicals (July)
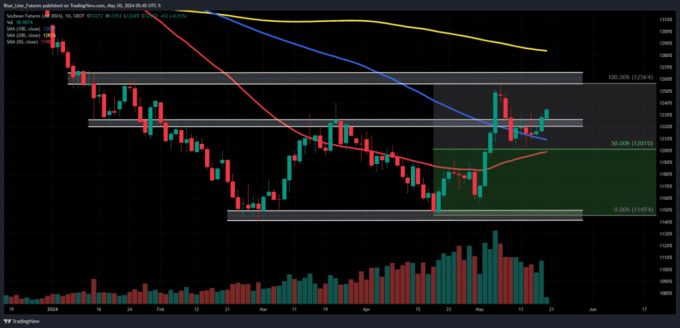
July soybean futures had an impressive session on Friday which has led to some early morning strength and prices retesting resistance from 1232 1/4-1236 3/4. If the Bulls can chew through this pocket, we could see a run back at 1252-1259 and possibly higher, with the 200-day moving average at 1283 3/4 being the next target. We've been hesitant to get excited about beans due to poor demand and the potential trade war headlines into the election, but ignoring the noise and looking at the chart, they are looking pretty good.
Friday's Commitment of Traders report showed funds were relatively flat last week, which aligns with the chart. Funds are net short roughly 43k Futures and options contracts.
Bias: Bullish/Neutral
Resistance: 1232 1/4-1236 3/4, 1252-1259
Pivot: 1220-1225
Support: 1199 1/2-1204, 1182 1/4-1186 1/4
Wheat
Technicals (July)
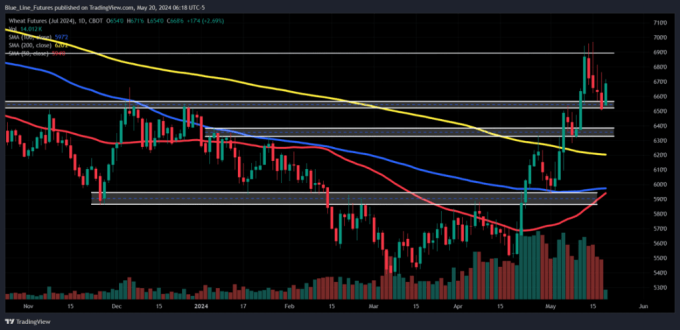
July wheat futures got hit hard last week but are showing signs of life in the early morning trade as prices recover and trade back north of our pivot pocket from 655-666. The overnight/early morning strength last week was faded on the opens, will it hold this go around? TBD. If the Bulls can achieve a close back above the upper end of our pivot pocket we believe it could help propel prices back towards resistance and potentially beyond. That next line in the sand comes in from 695-702.
Bias: Neutral/Bullish
Resistance: 695-702*, 727
Pivot: 655-666
Support: 635 1/4-639, 621 1/4-626 3/4*
Enjoying what you're reading?
Subscribe to our daily Grain Express for daily insights into Soybeans, Wheat, and Corn technicals, including our proprietary trading levels, and actionable market bias.
Sign Up for Free Futures Market Research – Blue Line Futures
Futures trading involves substantial risk of loss and may not be suitable for all investors. Therefore, carefully consider whether such trading is suitable for you in light of your financial condition. Trading advice is based on information taken from trade and statistical services and other sources Blue Line Futures, LLC believes are reliable. We do not guarantee that such information is accurate or complete and it should not be relied upon as such. Trading advice reflects our good faith judgment at a specific time and is subject to change without notice. There is no guarantee that the advice we give will result in profitable trades. All trading decisions will be made by the account holder. Past performance is not necessarily indicative of future results.
Blue Line Futures is a member of NFA and is subject to NFA’s regulatory oversight and examinations. However, you should be aware that the NFA does not have regulatory oversight authority over underlying or spot virtual currency products or transactions or virtual currency exchanges, custodians or markets. Therefore, carefully consider whether such trading is suitable for you considering your financial condition.
Hypothetical performance results have many inherent limitations, some of which are described below. No representation is being made that any account will or is likely to achieve profits or losses similar to those shown. In fact, there are frequently sharp differences between hypothetical performance results and the actual results subsequently achieved by any particular trading program.
One of the limitations of hypothetical performance results is that they are generally prepared with the benefit of hindsight. In addition, hypothetical trading does not involve financial risk, and no hypothetical trading record can completely account for the impact of financial risk in actual trading. For example, the ability to withstand losses or to adhere to a particular trading program in spite of trading losses are material points which can also adversely affect actual trading results. There are numerous other factors related to the markets in general or to the implementation of any specific trading program which cannot be fully accounted for in the preparation of hypothetical performance results and all of which can adversely affect actual trading results.
On the date of publication, Oliver Sloup did not have (either directly or indirectly) positions in any of the securities mentioned in this article. All information and data in this article is solely for informational purposes. For more information please view the Disclosure Policy here.
Disclaimer: The copyright of this article belongs to the original author. Reposting this article is solely for the purpose of information dissemination and does not constitute any investment advice. If there is any infringement, please contact us immediately. We will make corrections or deletions as necessary. Thank you.