Corn
Technicals (May)
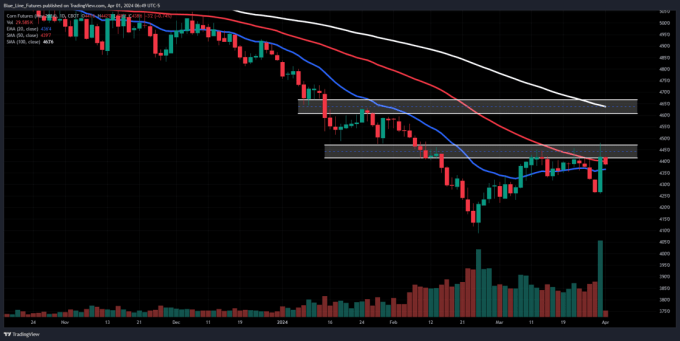
May corn futures were able to stage an impressive rally at the end of last week which took prices right back into our resistance pocket from 441 3/4-444 1/2. The failure to close above that pocket may be aiding in some early morning weakness which is taking prices back near the 20 and 50 day moving averages. We believe that we are entering a time of year that will provide more shorter-term opportunities for traders on both sides of the market as volatility and uncertainty around US Production start to move towards center stage.
Bias: Neutral
Resistance: 441 3/4-444 1/2, 447 1/2-450*
Pivot: 431 1/2-435
Support: 421-422***
Fundamental Notes
- The USDA estimates that there will be 90.036 million acres of corn planted in the U.S. this year, that was well below the average analyst estimate of 91.776 million and down sharply from last year’s 94.641 million.
- Quarterly stocks were reported at 8.347 billion bushels, this was slightly below the average estimate of 8.427 billion, but still well above last year’s 7.396.
Fund Positioning
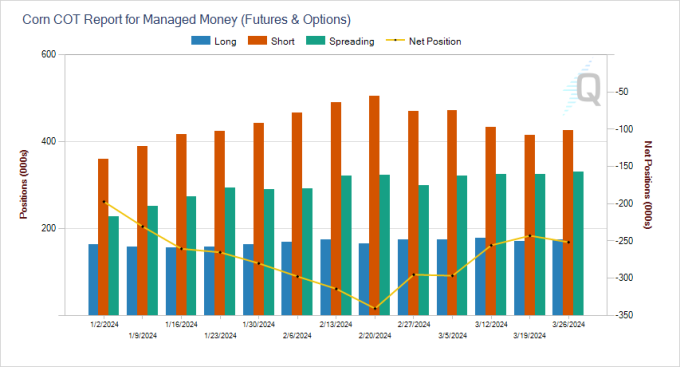
- Friday’s Commitment of Traders report showed that Funds were net sellers of about 9k contracts (through 3/26/24), that puts their net short position at 251,730.
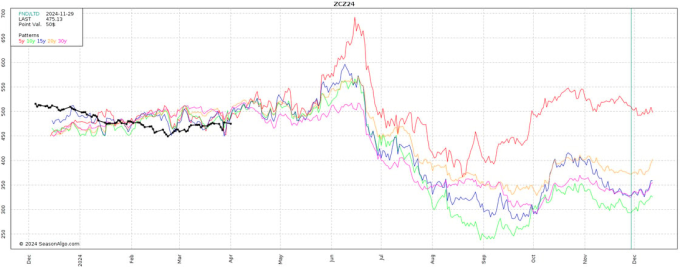
Seasonal Trends
(Past performance is not necessarily indicative of future results)
- Below is a look at price averages for December corn, using the 5, 10, 15, 20, and 30 year averages.
Soybeans
Technicals (May)
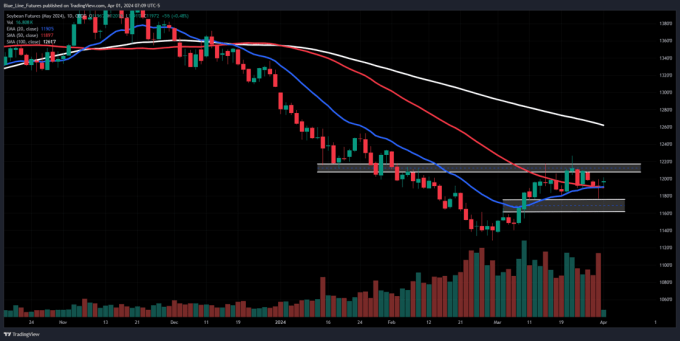
May soybean futures were under pressure before the big report but were able to trade back near unchanged into the long weekend. The chart looks half-way favorable, but the Bulls have their work cut out for them. For another leg higher they would want to see consecutive closes back above 1212 3/4-1216. If they can achieve that, we could see an extension towards the 100-day moving average.
Bias: Neutral
Resistance: 1212 3/4-1216, 1240 1/2, 1250-1252***
Pivot: 1198-1205 1/2
Support: 1175-1181, 1161-1167*
Fundamental Notes
- The USDA estimates that there will be 86.51 million acres of soybeans planted in the U.S. this year, that was a hair below the average analyst estimate of 86.53 million but still nearly 3 million acres more than last year.
- Quarterly stocks were reported at 1.845 billion bushels, this was slightly above the average estimate of 1.828 billion, and above last years 1.687 billion.
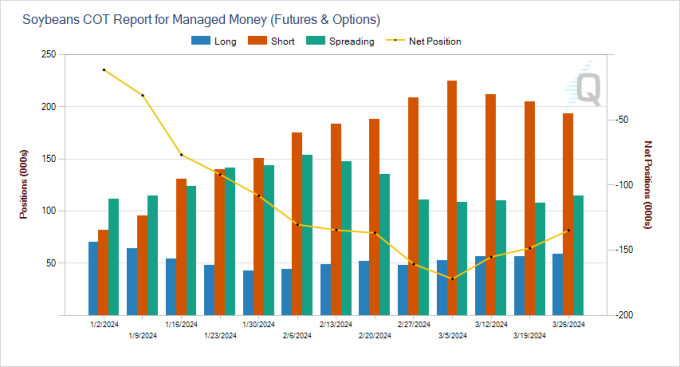
Fund Positioning
- Friday’s Commitment of Traders report showed Funds were net buyers of roughly 13.5k contracts, trimming their net short position to 134,780 contracts.
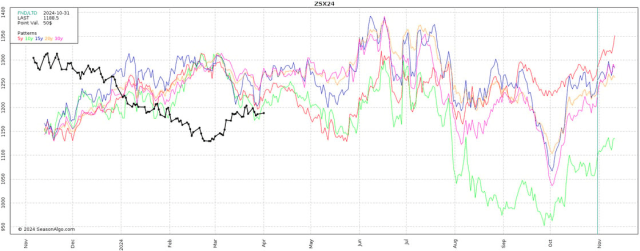
Seasonal Trends
(Past performance is not necessarily indicative of future results)
- Below is a look at price averages for November soybeans, using the 5, 10, 15, 20, and 30 year averages.
Continue Reading the full article at: Corn and Wheat Retreat - Blue Line Futures
On the date of publication, Oliver Sloup did not have (either directly or indirectly) positions in any of the securities mentioned in this article. All information and data in this article is solely for informational purposes. For more information please view the Disclosure Policy here.
Disclaimer: The copyright of this article belongs to the original author. Reposting this article is solely for the purpose of information dissemination and does not constitute any investment advice. If there is any infringement, please contact us immediately. We will make corrections or deletions as necessary. Thank you.