Hello everyone. In today’s article, we will look at the past performance of the 1H Hour Elliott Wave chart of VanEck Gold Miners ETF (GDX) . The rally from 2.28.2024 low at $25.66 unfolded as 5 waves impulse. So, we expected the pullback to unfold in 3 swings and find buyers again. We will explain the structure & forecast below:
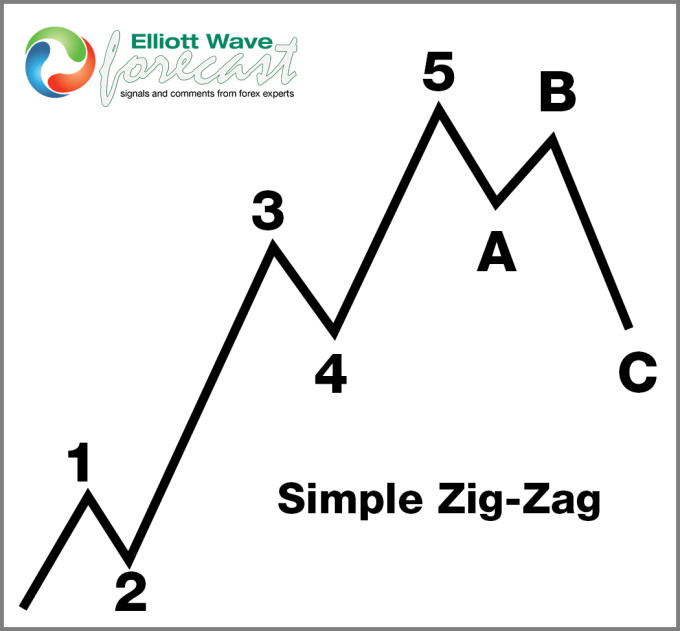
5 Wave Impulse Structure + ABC correction
$GDX 1H Elliott Wave Chart 3.19.2024:
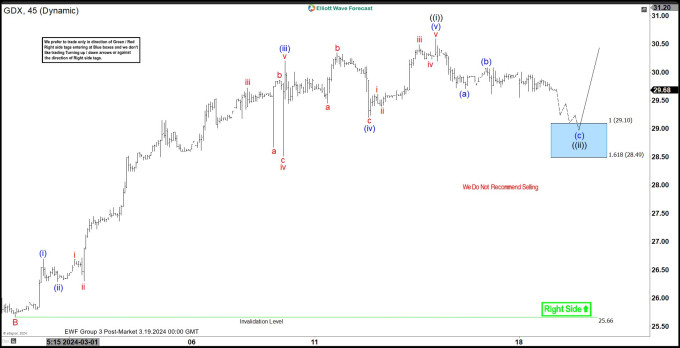
Here is the 1H Elliott Wave count from 3.19.2024. We expected the pullback to find buyers at the blue box area at 29.10 – 28.49 in 3 swings.
$GDX 1H Elliott Wave Chart 3.21.2024:
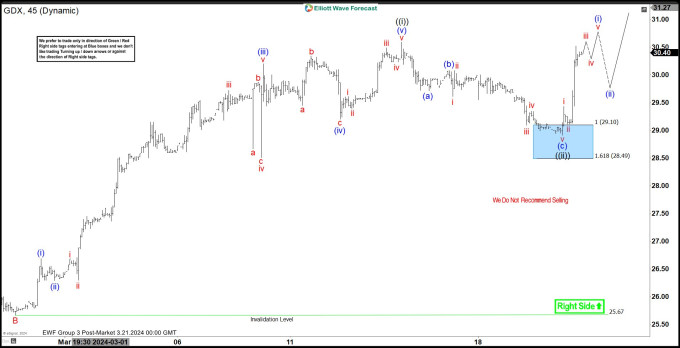
Here is the 1H update few days later from 3.21.2024 showing the bounce taking place as expected. The ETF has reacted higher from the blue box area allowing longs to get risk free. The ETF is expected to remain supported with a target area towards $33 – 36 before another pullback can happen.
Source: https://elliottwave-forecast.com/stock-market/vaneck-gold-miners-etf-gdx-found-buyers-blue-box-area-expected/
On the date of publication, Elliott Wave Forecast did not have (either directly or indirectly) positions in any of the securities mentioned in this article. All information and data in this article is solely for informational purposes. For more information please view the Disclosure Policy here.
Disclaimer: The copyright of this article belongs to the original author. Reposting this article is solely for the purpose of information dissemination and does not constitute any investment advice. If there is any infringement, please contact us immediately. We will make corrections or deletions as necessary. Thank you.