Get all of Blue Line Ag Hedge’s insights, alerts, recommendations, and more delivered to your inbox! Click Here to Learn More!
We believe seasonal tendencies are one of the foundational pillars when analyzing grain markets. Like technical analysis and often time fundamental analysis, it’s far from perfect, but using all three together can help provide a broader understanding of the market landscape, giving you the conviction you need to make those tough decisions, whether that be trading on paper or cash grain marketing.
The seasonal charts below show season averages on a 5, 10, 15, 20, and 30 year average. Below is a color key for the charts.
| Red | Green | Blue | Orange | Pink |
| 5 yr. avg. | 10 yr. avg. | 15 yr. avg | 20 yr. avg. | 30 yr. avg. |
This week’s seasonal time frame
In this week’s update we are zooming in on price data from March 6th to March 27th. We are using that time frame because we want to see how we trade up into the quarterly stocks report and prospective plantings report. If you want us to back test data for any market and any time frame, email Oliver@BlueLineAgHedge.com and we can pull that information for you.
Past performance is not necessarily indicative of future results.
Corn
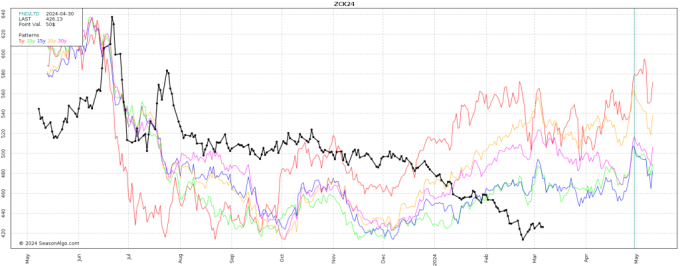
May Futures
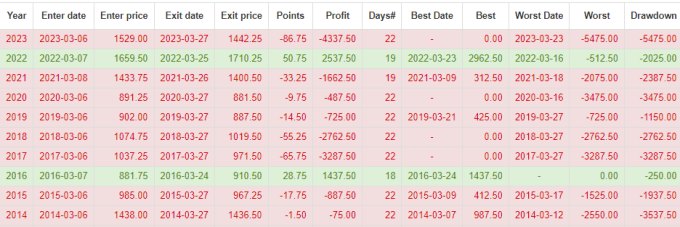
Over the last 10-years May corn futures have traded higher from March 6th to March 27th, seven times. The average gain was just shy of 5 1/2 cents. The average loss was roughly 22 1/4 cents, with the covid year being the biggest loss, 30 cents. Below is the seasonal chart along with a year-by-year breakdown of the data.

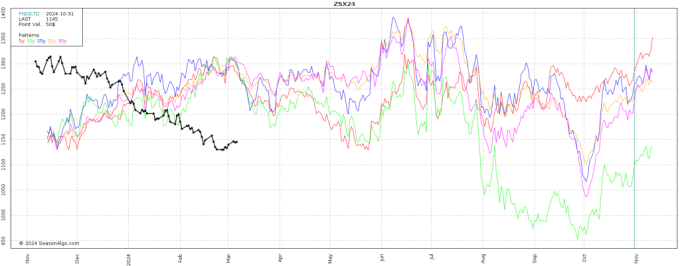
December Futures
Over the last 10 years December corn futures have rallied 4 times from March 6th to March 27th and declined 6 times. The average gain was 10 1/4 cents, the average decline was 10 1/4 cents. As you can see from the chart and year by year breakdown below, there isn’t a real strong correlation either way. Choppy Choppy.


Soybeans
May Soybeans
May soybeans have traded lower for 8 of the last 10 years from March 6th to March 27th with the average decline being roughly 35 1/2 cents. The two years we rallied averaged to be 39 3/4 cents. Important to note that seasonal averages showed prices rallying up to this point in time, which may have played a role in those declines. As you can see from the chart below, this year has been far from on par with seasonal tendencies.

November Soybeans
November soybeans have traded lower for 7 of the last 10 years from March 6th to March 27th. The average decline has been just shy of 39 cents. The three times we rallied averaged out to 26 3/4 cents. Looking at the chart you can see that seasonals have missed the mark so far this year which should probably be taken into account.

Get all of Blue Line Ag Hedge’s insights, alerts, recommendations, and more delivered to your inbox! Click Here to Learn More!
Trading involves substantial risk of loss and may not be suitable for all investors. Therefore, carefully consider whether such trading is suitable for you in light of your financial condition. Trading and hedging advice, along with market information is based on information taken from trade and statistical services and other sources Blue Line Ag Hedge, LLC believes are reliable. We do not guarantee that such information is accurate or complete and it should not be relied upon as such. Trading and hedging advice, along with market information reflects our good faith judgment at a specific time and is subject to change without notice. There is no guarantee that the advice we give will result in profitable trades. Past performance is not necessarily indicative of future results.
On the date of publication, Oliver Sloup did not have (either directly or indirectly) positions in any of the securities mentioned in this article. All information and data in this article is solely for informational purposes. For more information please view the Disclosure Policy here.
Disclaimer: The copyright of this article belongs to the original author. Reposting this article is solely for the purpose of information dissemination and does not constitute any investment advice. If there is any infringement, please contact us immediately. We will make corrections or deletions as necessary. Thank you.