In Case you missed it...
Oliver Sloup, Vice President and Co-Founder of Blue Line Futures was on RFD-TV yesterday morning sharing his thoughts on the grain and livestock markets with Scott the Cow Guy.
https://www.youtube.com/watch?v=gNNE8wubs9U
Corn
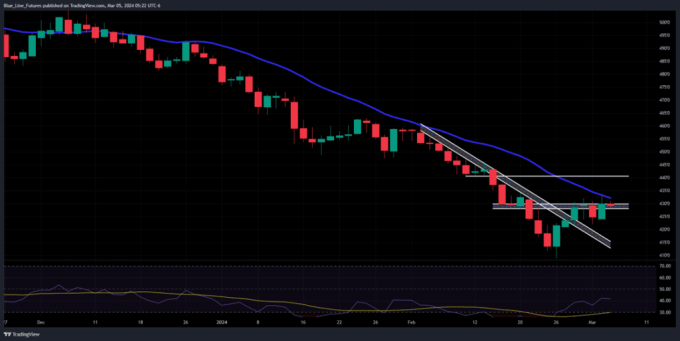
Technicals (May)
May corn futures tagged the 20-day moving average yesterday for the first time since December. Despite the initial failure and weaker prices in the early morning trade, the market is still knocking on the door of breaking out above it. Our first resistance pocket remains intact for today's trade, we see that coming in from 429 1/2-433 1/4. If the Bulls can chew through and close above this pocket, we could see an extension towards 440. On the flipside, the Bulls want to defend our pivot pocket from 421-422 to keep the newfound momentum in their favor.
Bias: Neutral/Bullish
Resistance: 429 1/2-433 1/4, 440-441
Pivot: 421-422
Support: 415-416*, 398-402
Fundamental Notes
Corn inspections totaled 1.08 million metric tons, 35% higher for the current marketing year versus last year, totaling 20.63 million tons.
USDA will release their monthly report on Friday, we hope to have estimates out by tomorrow. This will be the big-ticket item of the week but the quarterly stocks and prospective plantings report at the end of the month will be what most traders, hedgers, and analysts are looking forward to this month.
Seasonal Tendencies
(updated on Mondays)
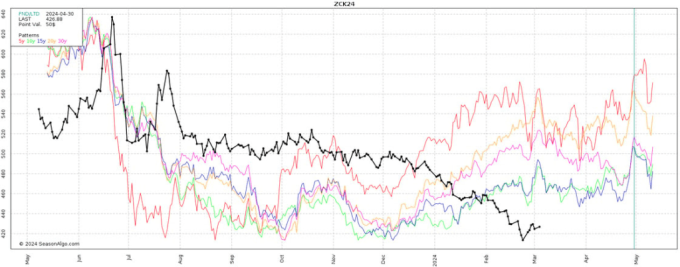
Below is a look at historical seasonal 5, 10, 15, 20, and 30 year averages for May corn futures (updated each Monday) VS today's prices (black line). Seasonally we see that corn has shown the ability to chop around in a mostly sideways trade from the first half of March up into the back half of April.
*Past performance is not necessarily indicative of futures results.
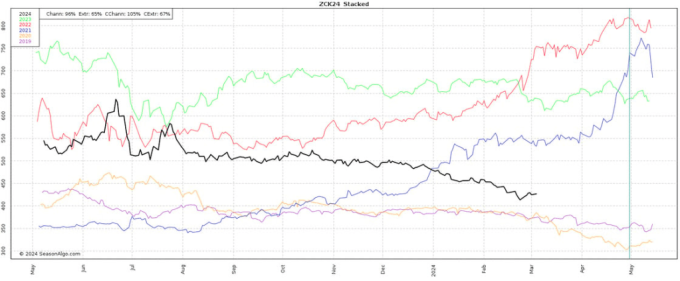
Below is a look at the last 5-years for May corn, which shows the three most recent years were able to stabilize and firm into April, while 2019 and 2020 prices continued to trickle lower during the same time frame.
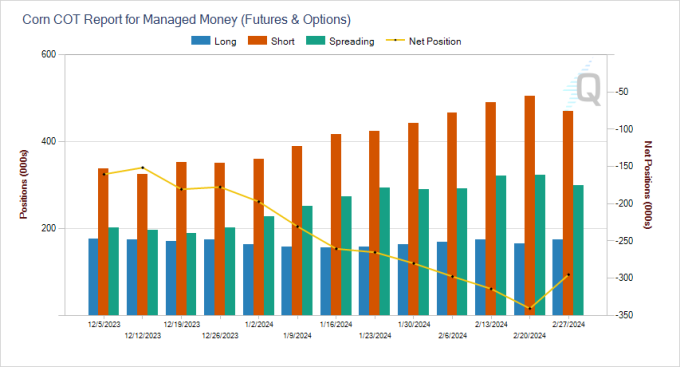
Fund Positioning
(updated on Mondays)
Friday's Commitment of Traders report showed Funds were net buyers of 45,475 futures and options contracts, broken down we see that 35,441 of that was short covering and 10,034 was new longs. That shrinks their net short position to 295,258 contracts, still one of the largest net short positions on record.
Soybeans
Technicals (May)
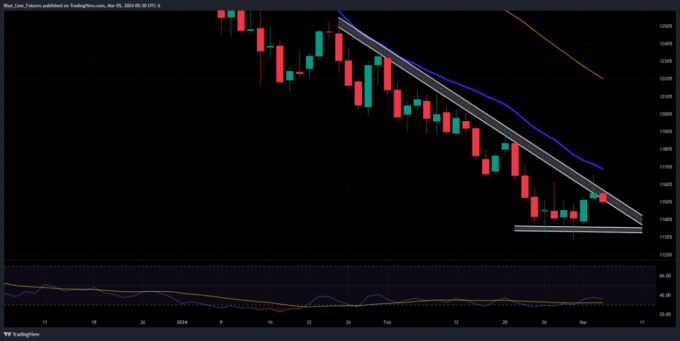
May soybean futures made a strong effort to breakout above trendline resistance, trading out above it in the early trade but ultimately fizzling out to finish near the lower end of the day's range. That reversal lower has led to some weakness in the overnight and early morning trade as prices are trading back below yesterday's low. If the Bulls can muster up the strength to get back out above trendline resistance, we could see it help gravitate prices towards the 20-day moving average which is continuing to work lower each day. We have not seen May soybeans trade on the 20-day moving average since November.
Bias: Neutral/Bullish
Resistance: 1163-1168, 1184*, 1198-1205 1/2
Pivot:
Support: 1125-1130**
Fundamental Notes
Soybean inspections totaled 1.02 million tons, 20% lower for the current marketing year versus last year.
USDA will release their monthly report on Friday, we hope to have estimates out by tomorrow. Perhaps now that harvest continues to move along in Brazil the USDA could make more meaningful cuts to Brazilian production to narrow the gap with many private analyst estimates.
Seasonal Tendencies
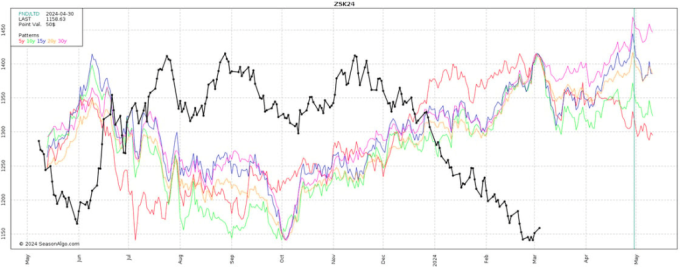
Seasonal tendencies have been out the window to start the year, so I'm not sure how much weight one puts into them at this juncture, but seasonally we tend to see some consolidation and strength from the middle of March to the middle of April.
*Past performance is not necessarily indicative of futures results.
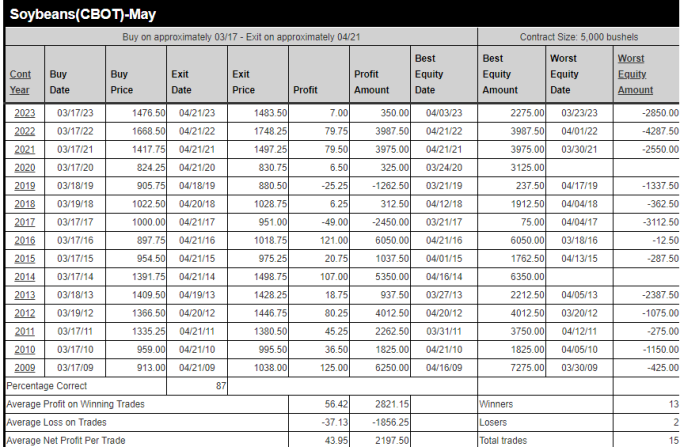
MRCI shows back tested results for a bullish seasonal that starts on March 17th and goes through April 21st. They show this as bullish for 13 of the last 15 years with the average rally being about 56 cents and the average loss being about 37 cents.
*Past performance is not necessarily indicative of futures results.
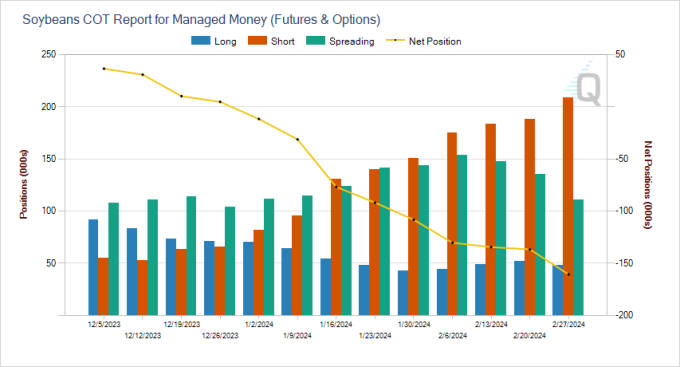
Commitment of Traders Snapshot
(updated on Mondays)
Friday's Commitment of Traders report showed yet another week of net selling by Funds, extending their net short position to 160,653 futures and options contracts. That's an increase of 23,975 contracts, 20,576 of which were new short positions.
Wheat
Technicals (May)
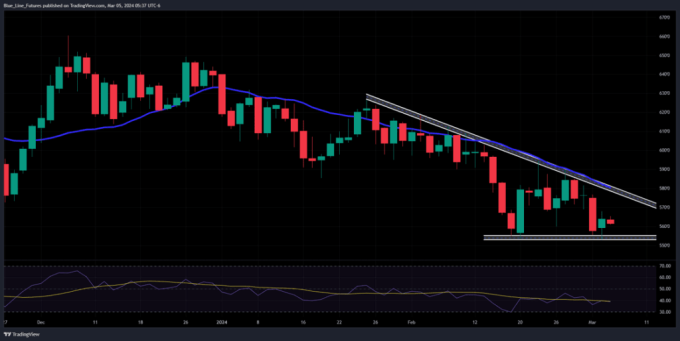
May wheat futures made new lows yesterday but were able to defend our support pocket from 550-555 as prices quickly snapped back higher and posted a decent day, eating into some of Friday's losses. With that said, there has been a lack of follow-through in the overnight and early morning trade. First resistance for today's trade comes in at 568 with more significant resistance points above that.
Bias: Neutral
Resistance: 573-578, 595 3/4-600, 608 1/2-611**
Pivot: 568
Support: 550-555**, 525
Fundamental Notes
Wheat inspections totaled 353,137 tons, 17% lower for the current marketing year versus last year.
Seasonal Tendencies
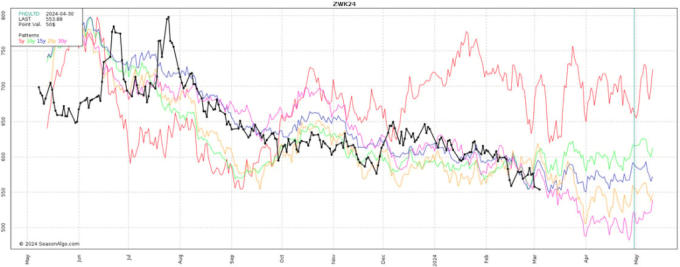
Below is a look at historical seasonal averages for May Chicago wheat futures VS this year's price (black line), updated each Monday. As you can see, seasonal tendencies start to soften up in the back half of March.
*Past performance is not necessarily indicative of futures results.
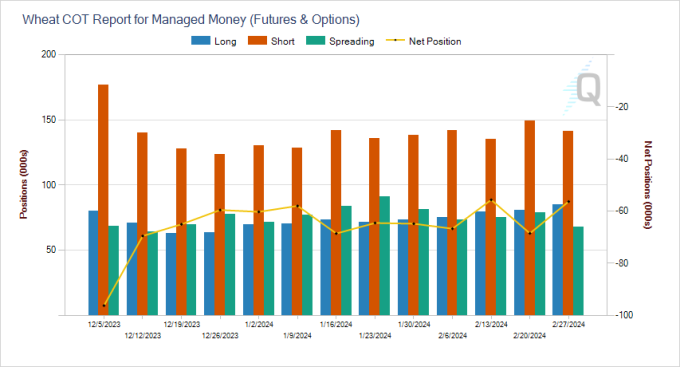
Commitment of Traders Snapshot
(updated on Mondays)Friday's Commitment of Traders report showed little change in the Managed Money net position. Funds are seen to be net short about 56k futures/options contracts.
Futures trading involves substantial risk of loss and may not be suitable for all investors. Therefore, carefully consider whether such trading is suitable for you in light of your financial condition. Trading advice is based on information taken from trade and statistical services and other sources Blue Line Futures, LLC believes are reliable. We do not guarantee that such information is accurate or complete and it should not be relied upon as such. Trading advice reflects our good faith judgment at a specific time and is subject to change without notice. There is no guarantee that the advice we give will result in profitable trades. All trading decisions will be made by the account holder. Past performance is not necessarily indicative of future results.
Blue Line Futures is a member of NFA and is subject to NFA’s regulatory oversight and examinations. However, you should be aware that the NFA does not have regulatory oversight authority over underlying or spot virtual currency products or transactions or virtual currency exchanges, custodians or markets. Therefore, carefully consider whether such trading is suitable for you considering your financial condition.
With Cyber-attacks on the rise, attacking firms in the healthcare, financial, energy and other state and global sectors, Blue Line Futures wants you to be safe! Blue Line Futures will never contact you via a third party application. Blue Line Futures employees use only firm authorized email addresses and phone numbers. If you are contacted by any person and want to confirm identity please reach out to us at info@bluelinefutures.com or call us at 312- 278-0500
Performance Disclaimer
Hypothetical performance results have many inherent limitations, some of which are described below. No representation is being made that any account will or is likely to achieve profits or losses similar to those shown. In fact, there are frequently sharp differences between hypothetical performance results and the actual results subsequently achieved by any particular trading program.
One of the limitations of hypothetical performance results is that they are generally prepared with the benefit of hindsight. In addition, hypothetical trading does not involve financial risk, and no hypothetical trading record can completely account for the impact of financial risk in actual trading. For example, the ability to withstand losses or to adhere to a particular trading program in spite of trading losses are material points which can also adversely affect actual trading results. There are numerous other factors related to the markets in general or to the implementation of any specific trading program which cannot be fully accounted for in the preparation of hypothetical performance results and all of which can adversely affect actual trading results.
On the date of publication, Oliver Sloup did not have (either directly or indirectly) positions in any of the securities mentioned in this article. All information and data in this article is solely for informational purposes. For more information please view the Disclosure Policy here.
Disclaimer: The copyright of this article belongs to the original author. Reposting this article is solely for the purpose of information dissemination and does not constitute any investment advice. If there is any infringement, please contact us immediately. We will make corrections or deletions as necessary. Thank you.