- Back in February 2023, the corn market was dealing with long-term downtrend in cash, futures, and ETFs.
- Oddly enough, the situation hasn't changed all that much in early 2024.
- A key difference, though, is the record large net-short futures position held by noncommercial traders.
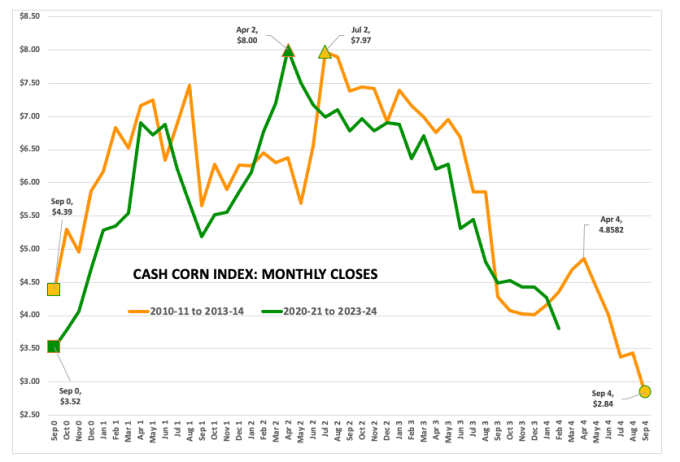
A year ago to the day, I wrote a piece titled “What’s Wrong With the Corn Market?”. In it I talked about how corn was simply doing what it was supposed to do based on long-term trends in the National Corn Index (ICY00), December futures, and the Teucrium Corn Fund (CORN). The bottom line was nothing was wrong with the market, but rather the majority of folks in the industry who talk about such things. As it turned out, most of them didn’t take the time to read what I had posted, with some expressing shock that I have been tracking the NCI from 2020 through 2024 in comparison to what it did during the 2010 to 2014 timeframe. Does it surprise me so few other “commentators/analysts/brokers” read the previous piece. Not at all. What I write doesn't tend to fit the narrative they are selling. I’ve gotten used to it by now.
But that was then. Let’s address the same question again, this time looking out over the next year. If I put my long-term investment hat on, I’d be looking at the continuous monthly chart for Dec futures only. As you can see, there is a lot going on here. First and foremost, Dec24 (ZCZ24) posted a new long-term low of $4.4675 in late February, just taking out the previous mark of $4.47 by Dec23 last November. At face value this could be considered bearish as it extended the long-term downtrend. However, it also sets the table for a potential bullish reversal if Dec24 can find a way to close the month above the January settlement of $4.80. It seems like a tall task but given the most bullish factor continues to be the record large net-short futures position held by noncommercial traders, it isn’t out of the question. And February 2024 has an extra day, so it has that going for it. Which is nice.

Then we have a question I was asked to open the week, “Do you think (the corn market) returns to the 2010s range of $3 to $4?”. This is an interesting query that goes back to the very nature of demand driven markets (demand markets create higher price ranges over time). The same continuous monthly chart for Dec corn-only shows a sideways range of approximately $4.20 to $3.20, spanning from roughly July 2014 through October 2020. Recall this sat on top of the pre-Energy Policy Act of 2005 range from approximately $3.00 to $1.80. That’s the nature of the beast. The sideways ranges slowly work higher.
If the ethanol demand market has gone away, then Dec24 (and the corn market in general) could indeed fall back into the previous range. After all, it was established after the aforementioned Energy Policy Act but before the US got into a social media driven trade war with China, as well as tariff fights with numerous other key trading partners. It is entirely possible this had shackled the previous demand-driven market. But why stop there? Can we expand the question to, “Will the corn market fall back to its early 2000s trading range from $1.00 to $3.00?”
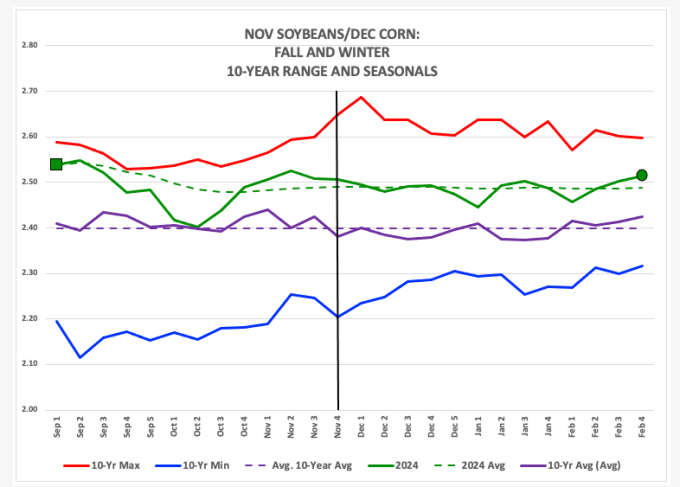
I don’t think so, at least not at this time. In fact, Dec24 corn looks to be in position to rally for a while. For those who aren’t naïve enough to wait for USDA’s Prospective Plantings report at the end of March, but rather have been tracking the Nov24 soybean/Dec24 corn futures spread, the likelihood of soybeans buying planted area away from corn in the US is real. In fact, the previous year closest to the 2024 spread was 2014 (there’s that year again) when US producers reportedly planted 8.5% more soybean acres than the previous year and 5% fewer corn acres. Despite this, Dec14 corn didn’t bottom out until October of that year at $3.1825. This means it dropped almost $2.00 from a planting season rally that took it to a high of $5.17 during April.
Chaos Theory tells us there is no such thing as an analogous year, as one difference in any factor can lead to a changed result. But there is precedence for Dec24 corn to come under pressure again before actually making a long-term bullish turn on its monthly chart. Still, after talking to some algorithm traders the last couple weeks, their systems are showing Dec24 corn to be more of a buy than a sell. If that is indeed the case, the market in general could see a round of noncommercial covering until renewed commercial pressure comes in.
What is wrong with the corn market? Absolutely nothing (Say it again…). The different aspects are doing what they should be doing at this time. We’ll see what the next year brings.
More Grain News from
- 2 Agriculture Stocks With Major Upside Potential, According to Wall Street
- Corn Continuing Higher into Tuesday
- Double Digit Strength for Tuesday Soybeans
- Wheat Beginning Tuesday with Follow Through Strength
On the date of publication, Darin Newsom did not have (either directly or indirectly) positions in any of the securities mentioned in this article. All information and data in this article is solely for informational purposes. For more information please view the Disclosure Policy here.
Disclaimer: The copyright of this article belongs to the original author. Reposting this article is solely for the purpose of information dissemination and does not constitute any investment advice. If there is any infringement, please contact us immediately. We will make corrections or deletions as necessary. Thank you.