- The National Corn Index continues to follow the path laid out a decade ago, meaning there is still plenty of room to the downside.
- The National Soybean Index completed a bearish technical pattern on its monthly close-only chart last April, projecting lower prices are still to be seen.
- The National HRW Wheat Index continues to grind lower as well as the market makes the annual migration from old-crop to new-crop in early March.
Limbo. In the dictionary I’ve had on my desk for more than 40 years, there are two definitions for the ‘Limbo’: 1. A region or condition of oblivion or neglect. 2. A dance in which the dancers keep bending over backward and passing under a pole that is lowered slightly each time. Both seem to fit one of the most frequently asked questions of me these days: How low can the National Cash Grain Indexes go? My friend Michelle Rook asked me that in an interview Thursday (February 15), and I was reminded of some of the technical targets I’ve already talked about for national corn and soybean indexes.
Those of you who have been following along might recall a piece I wrote nearly a year ago on the corn market. In it I talked about how the long-term trend of the various aspects of the corn market (cash, futures, fund) had turned down the previous spring (May 2022, if I remember correctly), with the monthly chart for the National Corn Price Index (ZCPAUS.CM) and continuous December corn showing a similar pattern. Just for good measure, it was also true for the Teucrium CORN fund. Since then Dec corn has lost roughly 22% and CORN is down about 23%. But what about the NCPI, the intrinsic value of the market?

As you know, I’ve been tracking the path of the cash corn index during 2020-2024 and comparing it to what we saw from 2010 through 2014. A decade ago the cash index posted a high monthly close of $7.97 at the end of July 2012 before falling to a low monthly close of $2.84 when September 2014 finished. For the record, this was a decrease of 64%. This time around the index had a high monthly close of $8.00 (April 2022) and has since fallen to Thursday evening’s calculation near $3.98, a loss of about 50%. Could this year’s NCPI fall below $3.00? Absolutely. Is there reason to believe it might not? Also yes, because so many other “analysts” (and I use that term loosely) are now calling for corn to continue to fall. For now, though, we need to keep Newsom’s Market Rule #1 in mind: Don’t get crossways with the trend. And the long-term trend remains down.
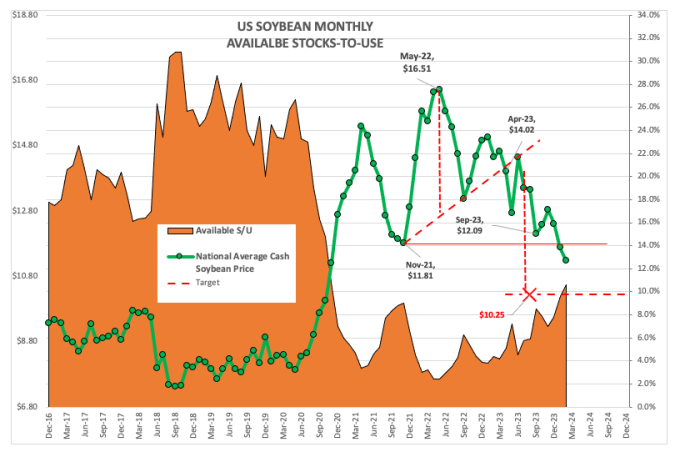
It's a similar story with the National Soybean Price Index (ZSPAUS.CM), though here my bearishness stems from a technical look at one of our key fundamental reads. This past April saw the cash index complete a head and shoulder top pattern on its monthly close-only chart, projecting a low monthly close of $10.25. (As I’ve said before, I’ll give market bulls a chance to get their heart going again after that statement.) What makes the intrinsic value of the soybean market so bearish? It’s simple: The social media driven trade war with China that began in February 2018 made the US a secondary player in the global market. That’s all there is to it. Since then, upswings in exports have only been caused by weather problems in Brazil. The NSPI was calculated Thursday evening at $11.10.
The latest weekly export sales and shipments update showed US total sales (total shipments plus unshipped sales) for the 2023-2024 marketing year of 1.426 bb, down 337 mb (19%) from the 1.763 bb reported the same week the previous marketing year. Additionally, total shipments of 1.117 bb projected marketing year export demand of 1.692 bb, down 226 mb from last year’s reported shipments of 1.918 bb. Recall this was 9% below the previous marketing year’s 2.101 bb, so the trend is easy to see. Is domestic crush, and soybean meal exports, making up for the export demand the US threw away? Not hardly. USDA’s latest round of monthly supply and demand guesses put 2023-2024 crush demand at 2.3 bb, up 88 mb from the previous marketing year which was up only 8 mb from the year before that. And while this week’s Annual Outlook Forum penciled crush demand in at 2.4 bb for next marketing year, up 100 mb year over year, we know we can’t trust these numbers because exports were increased by 155 mb. I’m not holding my breath on that one.
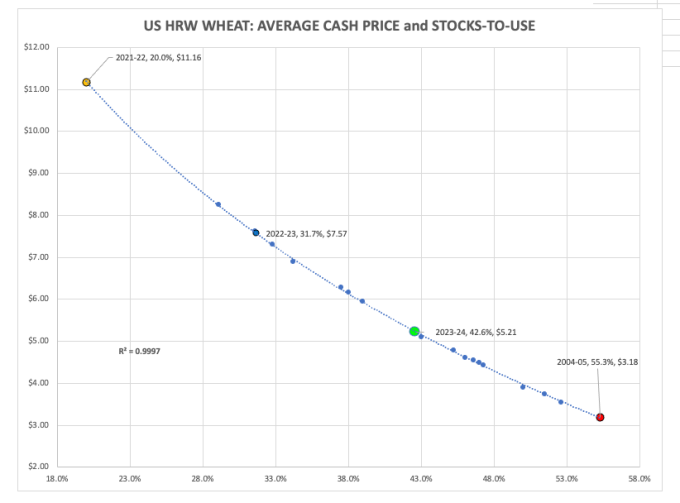
The National HRW Wheat Index ((IHY00) came in near $5.21 Thursday evening. This put it at its lowest price since December 2020 and correlated to an available stocks-to-use of 42.6%. This would challenge the lowest month end price for the index and highest available stocks-to-use since November 2020 ($5.20, 42.7%). How much lower could the HRW wheat index fall? For now, basis remains bearish as the market begins to transition away from old-crop and focusing on the 2024 crop in the field. For what its worth, the new-crop July Kansas City futures contract hit a new low of $5.5575 early Friday morning. So there’s that.
All is not hopeless, though. Recall my recent piece talking about the one bullish factor the various grain markets have in common: Noncommercial traders (funds) are holding net-short futures positions. If, for whatever reason, this group decides to start covering some of those positions it could lead to a rally in the futures markets. And if that happens, even if basis starts to weaken, it could be enough to lift the cash indexes at least a little.
More Grain News from
- Grain Markets: When Will Soybean, Corn, and Wheat Prices Recover?
- Soybeans Starting Firm on Friday
- Corn Prices Fractionally Mixed to Start Friday
- Wheat Markets Fading another Nickel
On the date of publication, Darin Newsom did not have (either directly or indirectly) positions in any of the securities mentioned in this article. All information and data in this article is solely for informational purposes. For more information please view the Disclosure Policy here.
Disclaimer: The copyright of this article belongs to the original author. Reposting this article is solely for the purpose of information dissemination and does not constitute any investment advice. If there is any infringement, please contact us immediately. We will make corrections or deletions as necessary. Thank you.